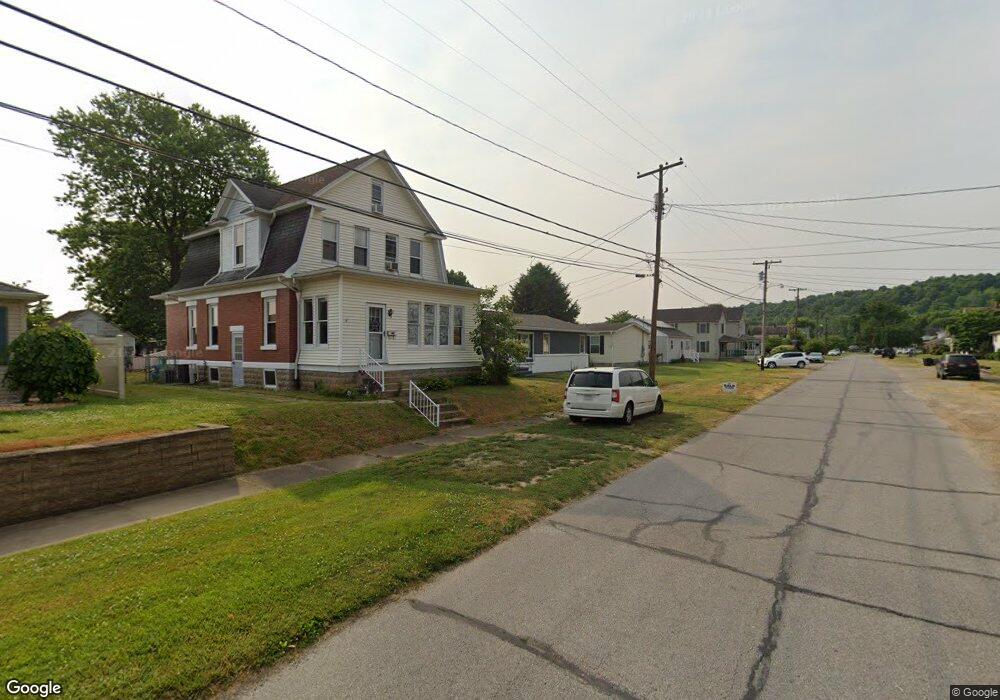
413 Poplar Ave Williamstown, WV 26187
Estimated Value: $116,413 - $164,000
3
Beds
2
Baths
936
Sq Ft
$149/Sq Ft
Est. Value
About This Home
This home is located at 413 Poplar Ave, Williamstown, WV 26187 and is currently estimated at $139,103, approximately $148 per square foot. 413 Poplar Ave is a home located in Wood County with nearby schools including Williamstown Elementary School, Williamstown Middle/High School, and Jackson Middle School.
Ownership History
Date
Name
Owned For
Owner Type
Purchase Details
Closed on
Oct 14, 2022
Sold by
Haddox Marsha R
Bought by
George Dalton L
Current Estimated Value
Home Financials for this Owner
Home Financials are based on the most recent Mortgage that was taken out on this home.
Original Mortgage
$77,082
Outstanding Balance
$66,426
Interest Rate
5.25%
Mortgage Type
New Conventional
Estimated Equity
$72,677
Purchase Details
Closed on
Sep 27, 2013
Sold by
Mccardell Ralph E
Bought by
Mccardell Marsha R and Mcnamara Marsha R
Purchase Details
Closed on
Dec 11, 2006
Sold by
Gainer James O
Bought by
Mcnamara Marsha R and Mcnamara Ralph E
Home Financials for this Owner
Home Financials are based on the most recent Mortgage that was taken out on this home.
Original Mortgage
$73,500
Interest Rate
8.37%
Mortgage Type
Adjustable Rate Mortgage/ARM
Create a Home Valuation Report for This Property
The Home Valuation Report is an in-depth analysis detailing your home's value as well as a comparison with similar homes in the area
Home Values in the Area
Average Home Value in this Area
Purchase History
| Date | Buyer | Sale Price | Title Company |
|---|---|---|---|
| George Dalton L | $73,500 | -- | |
| Mccardell Marsha R | -- | Approved Attorneys Title Com | |
| Mcnamara Marsha R | $73,900 | None Available |
Source: Public Records
Mortgage History
| Date | Status | Borrower | Loan Amount |
|---|---|---|---|
| Open | George Dalton L | $77,082 | |
| Previous Owner | Mcnamara Marsha R | $73,500 |
Source: Public Records
Tax History Compared to Growth
Tax History
| Year | Tax Paid | Tax Assessment Tax Assessment Total Assessment is a certain percentage of the fair market value that is determined by local assessors to be the total taxable value of land and additions on the property. | Land | Improvement |
|---|---|---|---|---|
| 2024 | $1,926 | $63,660 | $23,700 | $39,960 |
| 2023 | $820 | $60,660 | $23,100 | $37,560 |
| 2022 | $778 | $57,480 | $21,780 | $35,700 |
| 2021 | $745 | $54,780 | $20,400 | $34,380 |
| 2020 | $716 | $52,500 | $19,500 | $33,000 |
| 2019 | $723 | $51,600 | $18,900 | $32,700 |
| 2018 | $713 | $49,740 | $18,000 | $31,740 |
| 2017 | $698 | $48,480 | $17,400 | $31,080 |
| 2016 | $641 | $47,340 | $17,100 | $30,240 |
| 2015 | $620 | $45,780 | $16,500 | $29,280 |
| 2014 | $607 | $44,820 | $16,500 | $28,320 |
Source: Public Records
Map
Nearby Homes