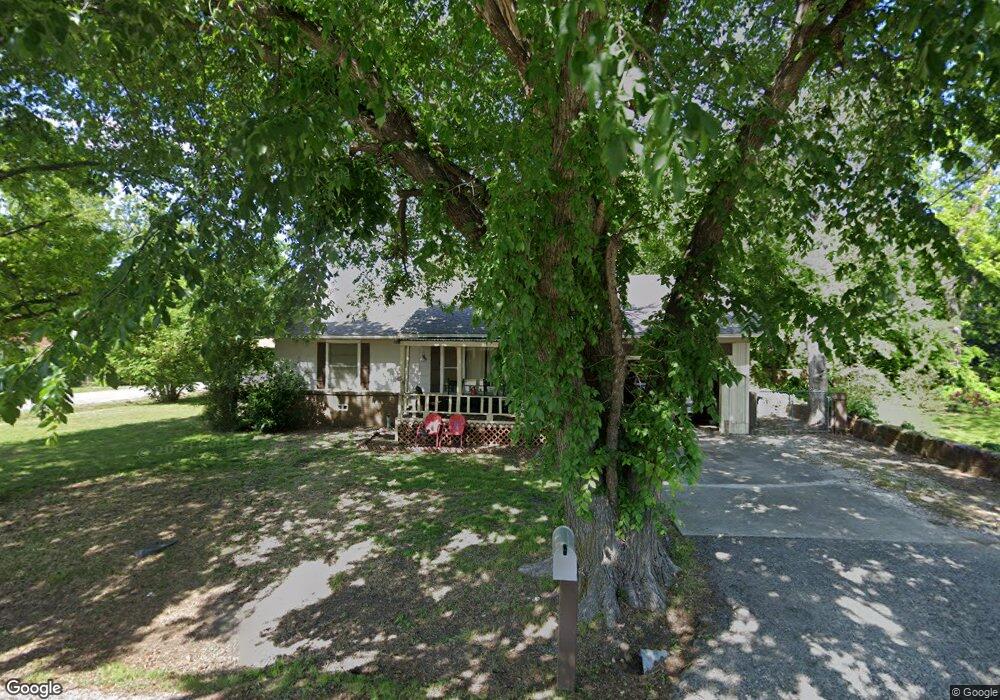
413 S 3rd St Sanger, TX 76266
Estimated Value: $217,785 - $271,000
Studio
--
Bath
1,448
Sq Ft
$168/Sq Ft
Est. Value
About This Home
This home is located at 413 S 3rd St, Sanger, TX 76266 and is currently estimated at $242,946, approximately $167 per square foot. 413 S 3rd St is a home located in Denton County with nearby schools including Butterfield Elementary School, Clear Creek Intermediate School, and Sanger Sixth Grade Campus.
Ownership History
Date
Name
Owned For
Owner Type
Purchase Details
Closed on
Sep 26, 1997
Sold by
Tyson Mary Lou and Vaughn Opal
Bought by
Price Doyce D and Price Sandra J
Current Estimated Value
Home Financials for this Owner
Home Financials are based on the most recent Mortgage that was taken out on this home.
Original Mortgage
$57,413
Outstanding Balance
$8,621
Interest Rate
7.56%
Mortgage Type
FHA
Estimated Equity
$234,325
Create a Home Valuation Report for This Property
The Home Valuation Report is an in-depth analysis detailing your home's value as well as a comparison with similar homes in the area
Home Values in the Area
Average Home Value in this Area
Purchase History
| Date | Buyer | Sale Price | Title Company |
|---|---|---|---|
| Price Doyce D | -- | -- | |
| Price Doyce D | -- | -- |
Source: Public Records
Mortgage History
| Date | Status | Borrower | Loan Amount |
|---|---|---|---|
| Open | Price Doyce D | $57,413 | |
| Closed | Price Doyce D | $57,413 |
Source: Public Records
Tax History
| Year | Tax Paid | Tax Assessment Tax Assessment Total Assessment is a certain percentage of the fair market value that is determined by local assessors to be the total taxable value of land and additions on the property. | Land | Improvement |
|---|---|---|---|---|
| 2025 | $942 | $158,554 | $65,925 | $92,629 |
| 2024 | $3,000 | $148,443 | $0 | $0 |
| 2023 | $849 | $134,948 | $51,275 | $83,673 |
| 2022 | $3,258 | $146,919 | $42,075 | $124,160 |
| 2021 | $2,807 | $145,969 | $34,425 | $111,544 |
| 2020 | $2,687 | $121,421 | $34,425 | $87,709 |
| 2019 | $2,513 | $110,383 | $34,425 | $91,191 |
| 2018 | $2,297 | $100,348 | $34,425 | $77,393 |
| 2017 | $2,098 | $91,225 | $34,425 | $68,140 |
| 2016 | $1,907 | $82,932 | $19,125 | $73,395 |
| 2015 | -- | $75,393 | $19,125 | $67,844 |
| 2013 | -- | $62,308 | $19,125 | $43,183 |
Source: Public Records
Map
Nearby Homes
Your Personal Tour Guide
Ask me questions while you tour the home.