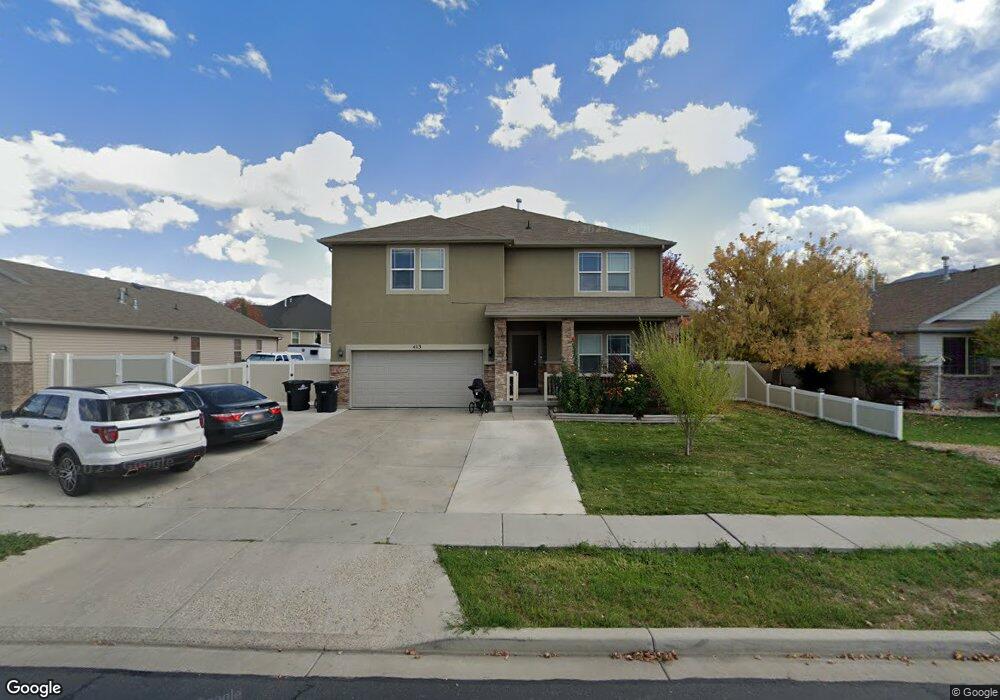
413 S 800 W Spanish Fork, UT 84660
Estimated Value: $497,000 - $716,000
4
Beds
3
Baths
3,600
Sq Ft
$173/Sq Ft
Est. Value
About This Home
This home is located at 413 S 800 W, Spanish Fork, UT 84660 and is currently estimated at $624,151, approximately $173 per square foot. 413 S 800 W is a home located in Utah County with nearby schools including Riverview Elementary School, Spanish Fork Jr High School, and Spanish Fork High School.
Ownership History
Date
Name
Owned For
Owner Type
Purchase Details
Closed on
Jun 7, 2013
Sold by
Moreno Alejandro Morales and Canel Susan G
Bought by
Moreno Ajejandro Morales and Morens Carmen
Current Estimated Value
Home Financials for this Owner
Home Financials are based on the most recent Mortgage that was taken out on this home.
Original Mortgage
$207,570
Outstanding Balance
$149,350
Interest Rate
3.75%
Mortgage Type
FHA
Estimated Equity
$474,801
Purchase Details
Closed on
Jun 8, 2010
Sold by
Romero Rene and Romero Beatriz
Bought by
Moreno Alejandro Morales and Canel Susan G
Home Financials for this Owner
Home Financials are based on the most recent Mortgage that was taken out on this home.
Original Mortgage
$192,408
Interest Rate
4.37%
Mortgage Type
FHA
Create a Home Valuation Report for This Property
The Home Valuation Report is an in-depth analysis detailing your home's value as well as a comparison with similar homes in the area
Home Values in the Area
Average Home Value in this Area
Purchase History
| Date | Buyer | Sale Price | Title Company |
|---|---|---|---|
| Moreno Ajejandro Morales | -- | Keystone Title Ins Agency | |
| Moreno Alejandro Morales | -- | Backman |
Source: Public Records
Mortgage History
| Date | Status | Borrower | Loan Amount |
|---|---|---|---|
| Open | Moreno Ajejandro Morales | $207,570 | |
| Closed | Moreno Alejandro Morales | $192,408 |
Source: Public Records
Tax History Compared to Growth
Tax History
| Year | Tax Paid | Tax Assessment Tax Assessment Total Assessment is a certain percentage of the fair market value that is determined by local assessors to be the total taxable value of land and additions on the property. | Land | Improvement |
|---|---|---|---|---|
| 2025 | $2,662 | $289,630 | $180,000 | $346,600 |
| 2024 | $2,662 | $274,395 | $0 | $0 |
| 2023 | $2,736 | $282,315 | $0 | $0 |
| 2022 | $2,618 | $264,990 | $0 | $0 |
| 2021 | $2,230 | $361,100 | $107,500 | $253,600 |
| 2020 | $2,126 | $334,700 | $97,700 | $237,000 |
| 2019 | $1,921 | $318,100 | $89,100 | $229,000 |
| 2018 | $1,858 | $297,400 | $82,000 | $215,400 |
| 2017 | $1,710 | $147,125 | $0 | $0 |
| 2016 | $1,619 | $137,445 | $0 | $0 |
| 2015 | $1,606 | $134,750 | $0 | $0 |
| 2014 | $1,421 | $119,680 | $0 | $0 |
Source: Public Records
Map
Nearby Homes
- 501 S 880 W
- 2645 W 360 S Unit 1
- 2576 W 360 S Unit 5
- 231 S 880 W
- 1026 W 350 S
- 333 S 1170 W
- 351 W 530 S
- 1076 River Hill Dr
- 1701 Del Monte Rd Unit 21
- 13 N 710 W
- 88 S 400 W
- 1040 W Center St
- 429 S 1280 W
- 956 W 40 N
- 1171 W 800 S Unit 38
- 225 W 300 S
- 1299 W 250 S
- 1256 W 800 S Unit 25
- 1256 W 800 S
- 1377 W 450 S