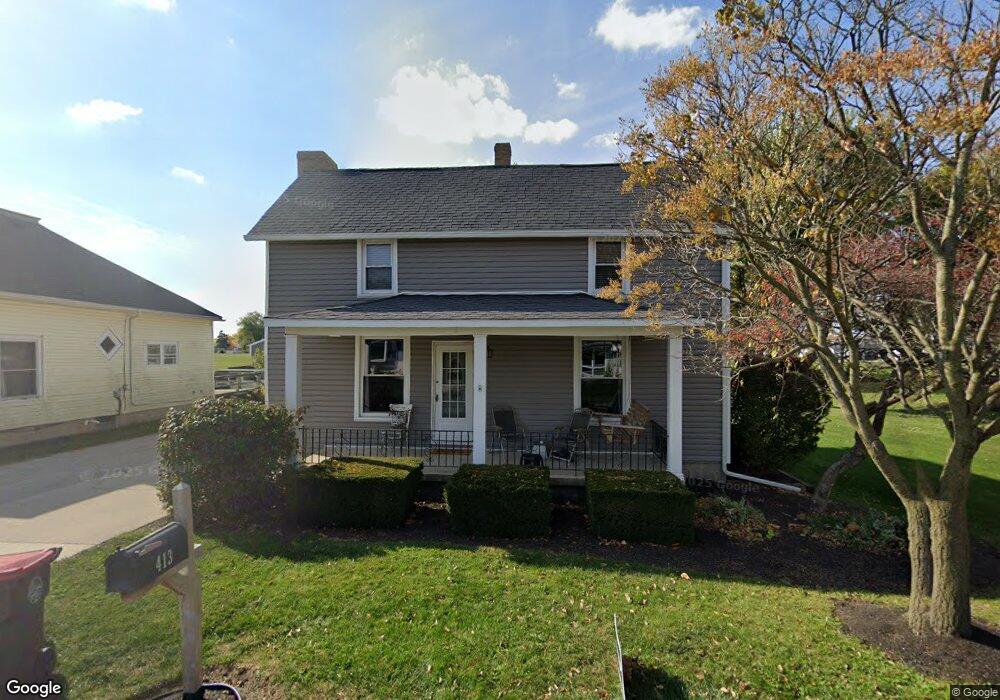
413 S Pine St Wapakoneta, OH 45895
Estimated Value: $169,000 - $187,000
3
Beds
1
Bath
1,520
Sq Ft
$117/Sq Ft
Est. Value
About This Home
This home is located at 413 S Pine St, Wapakoneta, OH 45895 and is currently estimated at $178,000, approximately $117 per square foot. 413 S Pine St is a home located in Auglaize County with nearby schools including Wapakoneta Elementary School, Wapakoneta High School, and Wapakoneta Middle School.
Ownership History
Date
Name
Owned For
Owner Type
Purchase Details
Closed on
Sep 6, 2007
Sold by
Crow Herman C and Crow Kay A
Bought by
Hall Joshua L
Current Estimated Value
Home Financials for this Owner
Home Financials are based on the most recent Mortgage that was taken out on this home.
Original Mortgage
$91,500
Outstanding Balance
$58,109
Interest Rate
6.63%
Mortgage Type
Purchase Money Mortgage
Estimated Equity
$119,891
Purchase Details
Closed on
Apr 17, 2003
Sold by
Duty Thomas E
Bought by
Crow Herman C Jr & Kay A Trustees
Purchase Details
Closed on
Feb 20, 2001
Sold by
Duty Thomas E and Duty Linda L
Bought by
Duty Thomas E
Purchase Details
Closed on
Oct 18, 1996
Sold by
Sanfilippo Philip J
Bought by
Duty Thomas E and Duty Linda L
Purchase Details
Closed on
Feb 27, 1995
Sold by
Gearing J Donald
Bought by
Sanfilippo Philip J
Create a Home Valuation Report for This Property
The Home Valuation Report is an in-depth analysis detailing your home's value as well as a comparison with similar homes in the area
Home Values in the Area
Average Home Value in this Area
Purchase History
| Date | Buyer | Sale Price | Title Company |
|---|---|---|---|
| Hall Joshua L | $91,500 | None Available | |
| Crow Herman C Jr & Kay A Trustees | $75,000 | -- | |
| Duty Thomas E | -- | -- | |
| Duty Thomas E | $68,000 | -- | |
| Sanfilippo Philip J | $65,000 | -- |
Source: Public Records
Mortgage History
| Date | Status | Borrower | Loan Amount |
|---|---|---|---|
| Open | Hall Joshua L | $91,500 |
Source: Public Records
Tax History Compared to Growth
Tax History
| Year | Tax Paid | Tax Assessment Tax Assessment Total Assessment is a certain percentage of the fair market value that is determined by local assessors to be the total taxable value of land and additions on the property. | Land | Improvement |
|---|---|---|---|---|
| 2024 | $2,203 | $45,190 | $15,320 | $29,870 |
| 2023 | $749 | $45,190 | $15,320 | $29,870 |
| 2022 | $1,351 | $37,090 | $14,000 | $23,090 |
| 2021 | $656 | $37,090 | $14,000 | $23,090 |
| 2020 | $1,335 | $37,090 | $13,997 | $23,093 |
| 2019 | $1,143 | $30,457 | $11,494 | $18,963 |
| 2018 | $1,146 | $30,457 | $11,494 | $18,963 |
| 2017 | $1,141 | $30,457 | $11,494 | $18,963 |
| 2016 | $1,052 | $28,154 | $10,885 | $17,269 |
| 2015 | $1,039 | $28,154 | $10,885 | $17,269 |
| 2014 | $1,050 | $28,154 | $10,885 | $17,269 |
| 2013 | $1,069 | $28,154 | $10,885 | $17,269 |
Source: Public Records
Map
Nearby Homes
- 409 S Pine St
- 201 E Pearl St
- 0 Ohio 67
- 9 E Silver St
- 102 Wapak St
- 307 W Auglaize St
- 414 W Auglaize St
- 608 W Benton St
- 814 W Benton St
- 420 Hoopengarner St
- 322 Cole Dr
- 0 Wapakoneta Cridersville Rd
- 106 Valleyview Dr
- 808 Aster Dr
- 1100 W Auglaize St
- 906 Aster Dr
- 924 Poppy Dr
- 920 Primrose Dr
- 601 Warren St
- 1028 Stonegate Ct