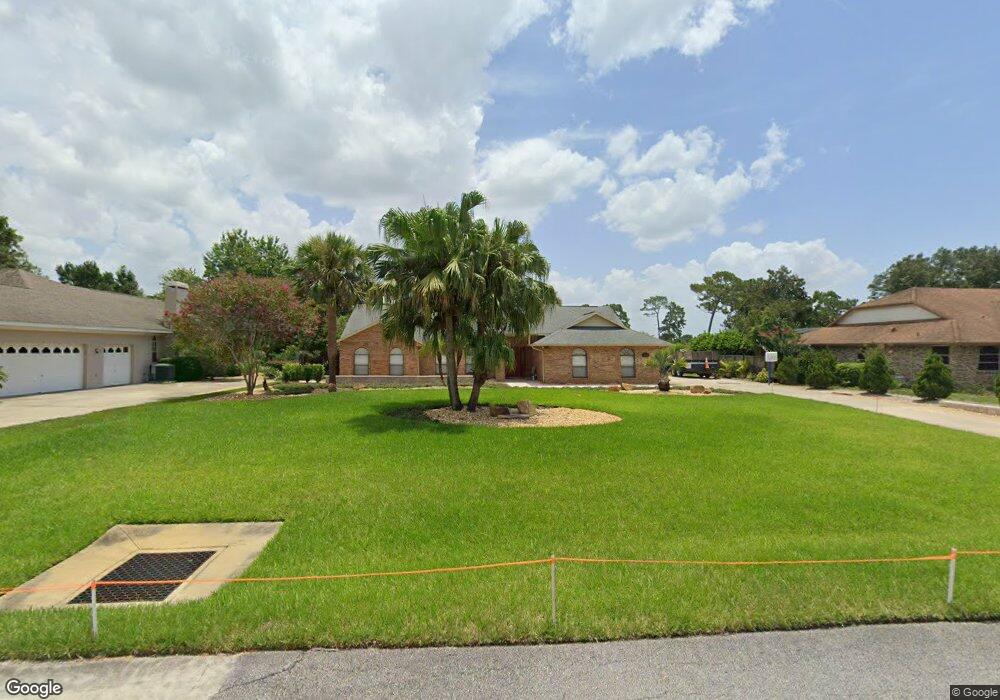
413 Soft Shadow Ln Debary, FL 32713
Glen Abbey NeighborhoodEstimated Value: $414,864 - $461,000
3
Beds
2
Baths
3,038
Sq Ft
$146/Sq Ft
Est. Value
About This Home
This home is located at 413 Soft Shadow Ln, Debary, FL 32713 and is currently estimated at $442,216, approximately $145 per square foot. 413 Soft Shadow Ln is a home located in Volusia County with nearby schools including Debary Elementary School, River Springs Middle School, and University High School.
Ownership History
Date
Name
Owned For
Owner Type
Purchase Details
Closed on
Aug 16, 2016
Sold by
Cooper Lisa L
Bought by
Bechir Kerry A
Current Estimated Value
Home Financials for this Owner
Home Financials are based on the most recent Mortgage that was taken out on this home.
Original Mortgage
$121,794
Outstanding Balance
$95,641
Interest Rate
3.25%
Mortgage Type
FHA
Estimated Equity
$346,575
Purchase Details
Closed on
May 27, 2014
Sold by
Cooper Lisa L
Bought by
Cooper Lisa L and Bechir Kerry A
Purchase Details
Closed on
Jul 6, 2012
Sold by
Mederer David B
Bought by
Cooper Lisa L
Home Financials for this Owner
Home Financials are based on the most recent Mortgage that was taken out on this home.
Original Mortgage
$120,000
Interest Rate
3.76%
Mortgage Type
New Conventional
Purchase Details
Closed on
Sep 4, 2001
Sold by
Mederer Stanis J
Bought by
Mederer Stanis J
Purchase Details
Closed on
Mar 15, 1991
Bought by
Bechir Kerry A
Purchase Details
Closed on
Sep 15, 1989
Bought by
Bechir Kerry A
Create a Home Valuation Report for This Property
The Home Valuation Report is an in-depth analysis detailing your home's value as well as a comparison with similar homes in the area
Home Values in the Area
Average Home Value in this Area
Purchase History
| Date | Buyer | Sale Price | Title Company |
|---|---|---|---|
| Bechir Kerry A | $56,029 | Esquire Title Services Inc | |
| Cooper Lisa L | $116,000 | None Available | |
| Cooper Lisa L | $150,000 | Esquire Title Services Inc | |
| Mederer Stanis J | -- | -- | |
| Bechir Kerry A | $45,000 | -- | |
| Bechir Kerry A | $37,500 | -- |
Source: Public Records
Mortgage History
| Date | Status | Borrower | Loan Amount |
|---|---|---|---|
| Open | Bechir Kerry A | $121,794 | |
| Previous Owner | Cooper Lisa L | $120,000 |
Source: Public Records
Tax History
| Year | Tax Paid | Tax Assessment Tax Assessment Total Assessment is a certain percentage of the fair market value that is determined by local assessors to be the total taxable value of land and additions on the property. | Land | Improvement |
|---|---|---|---|---|
| 2026 | $3,260 | $220,766 | -- | -- |
| 2025 | $3,260 | $220,766 | -- | -- |
| 2024 | $2,950 | $214,545 | -- | -- |
| 2023 | $2,950 | $208,297 | $0 | $0 |
| 2022 | $2,881 | $202,230 | $0 | $0 |
| 2021 | $2,977 | $196,340 | $0 | $0 |
| 2020 | $2,965 | $193,629 | $0 | $0 |
| 2019 | $3,107 | $189,276 | $0 | $0 |
| 2018 | $3,005 | $185,747 | $0 | $0 |
| 2017 | $3,063 | $181,927 | $0 | $0 |
| 2016 | $2,944 | $178,185 | $0 | $0 |
| 2015 | $2,962 | $174,300 | $0 | $0 |
| 2014 | $3,310 | $166,081 | $0 | $0 |
Source: Public Records
Map
Nearby Homes
- 411 Glen Abbey Ln
- 2859 Stags Leap Dr
- 617 Fawn Ridge Dr
- 253 Glen Abbey Ln
- 481 Woodford Dr Unit IIIA
- 540 S Pine Meadow Dr
- 230 Brassington Dr
- 910 Regatta Bay Dr Unit 5-201
- 930 Moonlight Cove Rd Unit 11107
- 102 Pine Side Dr Unit 8
- 2713 Call Ave
- 19 Ramada Dr
- 21 Fleetwood Ave
- 520 Summerhaven Dr
- 39 Ramada Dr
- 15 Ramada Dr
- 37 Fleetwood Ave
- 72 Spring Lake Dr
- 1037 Collins Ave
- 3 Pine Glen Dr
- 411 Soft Shadow Ln
- 415 Soft Shadow Ln
- 409 Soft Shadow Ln
- 417 Soft Shadow Ln
- 412 Soft Shadow Ln
- 410 Soft Shadow Ln
- 414 Soft Shadow Ln
- 419 Soft Shadow Ln
- 408 Soft Shadow Ln
- 416 Soft Shadow Ln
- 406 Soft Shadow Ln
- 418 Soft Shadow Ln
- 421 Soft Shadow Ln
- 405 Soft Shadow Ln
- 404 Soft Shadow Ln
- 420 Soft Shadow Ln
- 423 Soft Shadow Ln
- 403 Soft Shadow Ln
- 422 Soft Shadow Ln
- 402 Soft Shadow Ln
Your Personal Tour Guide
Ask me questions while you tour the home.