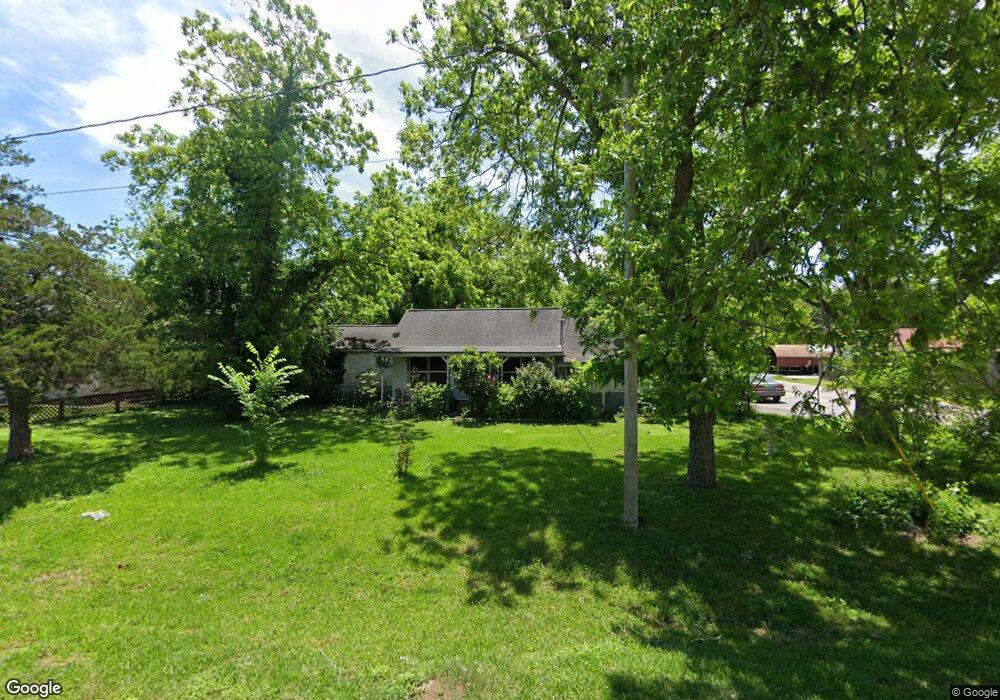
413 W Elm St Brazoria, TX 77422
Estimated Value: $123,364 - $242,000
--
Bed
1
Bath
1,234
Sq Ft
$138/Sq Ft
Est. Value
About This Home
This home is located at 413 W Elm St, Brazoria, TX 77422 and is currently estimated at $169,841, approximately $137 per square foot. 413 W Elm St is a home located in Brazoria County.
Ownership History
Date
Name
Owned For
Owner Type
Purchase Details
Closed on
Mar 20, 2018
Sold by
Slezinsky Michelle and Estate Of Flolrenina Olivo Sle
Bought by
Slezinsky Robbie and Slezinsky Michelle
Current Estimated Value
Purchase Details
Closed on
Mar 1, 2018
Sold by
Slezinsky Henry
Bought by
Slezinsky Bobbie
Purchase Details
Closed on
Feb 12, 2018
Sold by
Curran Daniel
Bought by
Slezinsky Bobbie and Slezinsky Michelle
Purchase Details
Closed on
Aug 4, 2011
Sold by
Reichert David E and Estate Of Will A Reichert
Bought by
Curran Daniel C and Curran Michael J
Home Financials for this Owner
Home Financials are based on the most recent Mortgage that was taken out on this home.
Original Mortgage
$78,399
Interest Rate
4.52%
Mortgage Type
Purchase Money Mortgage
Create a Home Valuation Report for This Property
The Home Valuation Report is an in-depth analysis detailing your home's value as well as a comparison with similar homes in the area
Home Values in the Area
Average Home Value in this Area
Purchase History
| Date | Buyer | Sale Price | Title Company |
|---|---|---|---|
| Slezinsky Robbie | -- | None Available | |
| Slezinsky Bobbie | -- | None Available | |
| Slezinsky Bobbie | -- | None Available | |
| Curran Daniel C | -- | Stewart Title |
Source: Public Records
Mortgage History
| Date | Status | Borrower | Loan Amount |
|---|---|---|---|
| Previous Owner | Curran Daniel C | $78,399 |
Source: Public Records
Tax History Compared to Growth
Tax History
| Year | Tax Paid | Tax Assessment Tax Assessment Total Assessment is a certain percentage of the fair market value that is determined by local assessors to be the total taxable value of land and additions on the property. | Land | Improvement |
|---|---|---|---|---|
| 2025 | $968 | $107,484 | $18,590 | $91,860 |
| 2023 | $968 | $100,168 | $20,000 | $140,710 |
| 2022 | $2,057 | $91,062 | $17,650 | $91,390 |
| 2021 | $1,341 | $56,917 | $10,201 | $46,716 |
| 2020 | $1,316 | $55,110 | $9,414 | $45,696 |
| 2019 | $1,234 | $48,356 | $4,460 | $43,896 |
| 2018 | $1,278 | $49,796 | $4,407 | $45,389 |
| 2017 | $1,983 | $74,690 | $6,610 | $68,080 |
| 2016 | $1,907 | $71,830 | $5,510 | $66,320 |
| 2014 | $1,543 | $57,500 | $5,510 | $51,990 |
Source: Public Records
Map
Nearby Homes