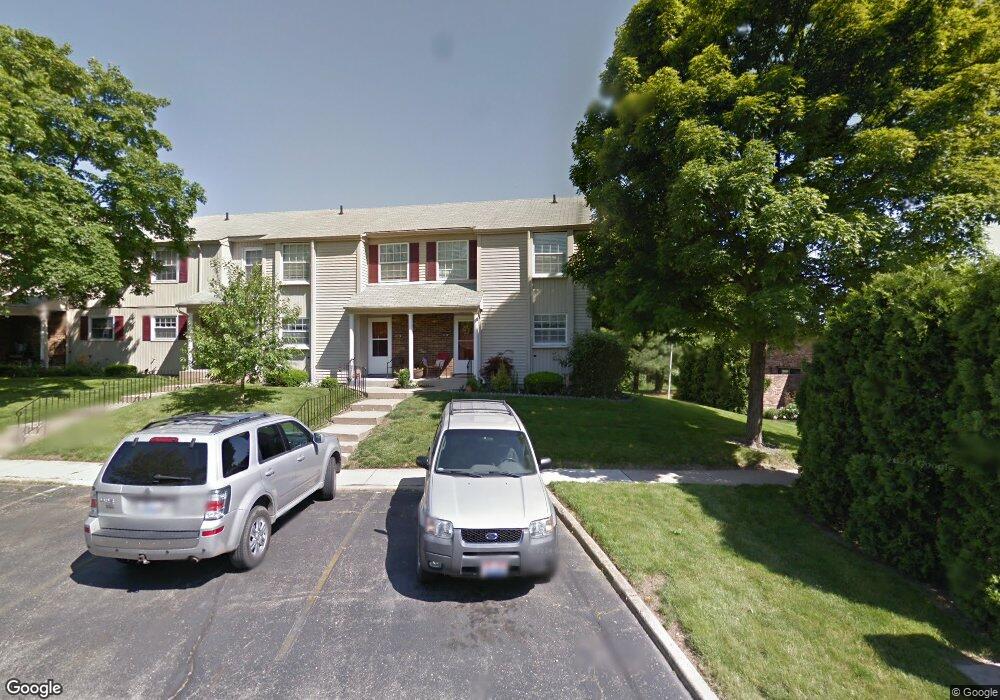
413 Williamsburg Ln NW Unit 14C Lancaster, OH 43130
Estimated Value: $180,000 - $191,000
3
Beds
2
Baths
1,092
Sq Ft
$169/Sq Ft
Est. Value
About This Home
This home is located at 413 Williamsburg Ln NW Unit 14C, Lancaster, OH 43130 and is currently estimated at $184,959, approximately $169 per square foot. 413 Williamsburg Ln NW Unit 14C is a home located in Fairfield County with nearby schools including General Sherman Junior High School, Lancaster High School, and St Mary Elementary School.
Ownership History
Date
Name
Owned For
Owner Type
Purchase Details
Closed on
May 28, 2016
Sold by
Stutzman David A
Bought by
Hicks Joshua M and Hicks Julie L
Current Estimated Value
Home Financials for this Owner
Home Financials are based on the most recent Mortgage that was taken out on this home.
Original Mortgage
$77,503
Outstanding Balance
$61,864
Interest Rate
3.66%
Mortgage Type
New Conventional
Estimated Equity
$123,095
Purchase Details
Closed on
May 29, 2008
Sold by
Fishbaugh Daniel Lee and Wallace Harry C
Bought by
Stutzman David A
Home Financials for this Owner
Home Financials are based on the most recent Mortgage that was taken out on this home.
Original Mortgage
$82,348
Interest Rate
6.01%
Mortgage Type
FHA
Purchase Details
Closed on
Oct 30, 2007
Sold by
Fishbaugh Daniel Lee and Wallace Harry C
Bought by
Fishbaugh Daniel Lee and Wallace Harry C
Purchase Details
Closed on
Sep 21, 1992
Sold by
Fogg Donald E
Bought by
Fishbaugh Daniel Lee
Create a Home Valuation Report for This Property
The Home Valuation Report is an in-depth analysis detailing your home's value as well as a comparison with similar homes in the area
Home Values in the Area
Average Home Value in this Area
Purchase History
| Date | Buyer | Sale Price | Title Company |
|---|---|---|---|
| Hicks Joshua M | $79,900 | Valmer Land Title Agency | |
| Stutzman David A | $83,000 | Attorney | |
| Fishbaugh Daniel Lee | -- | Attorney | |
| Fishbaugh Daniel Lee | $47,000 | -- |
Source: Public Records
Mortgage History
| Date | Status | Borrower | Loan Amount |
|---|---|---|---|
| Open | Hicks Joshua M | $77,503 | |
| Closed | Stutzman David A | $82,348 |
Source: Public Records
Tax History Compared to Growth
Tax History
| Year | Tax Paid | Tax Assessment Tax Assessment Total Assessment is a certain percentage of the fair market value that is determined by local assessors to be the total taxable value of land and additions on the property. | Land | Improvement |
|---|---|---|---|---|
| 2024 | $3,763 | $41,860 | $7,000 | $34,860 |
| 2023 | $1,523 | $41,860 | $7,000 | $34,860 |
| 2022 | $1,529 | $41,860 | $7,000 | $34,860 |
| 2021 | $1,335 | $34,240 | $7,000 | $27,240 |
| 2020 | $1,279 | $34,240 | $7,000 | $27,240 |
| 2019 | $1,216 | $34,240 | $7,000 | $27,240 |
| 2018 | $1,122 | $28,090 | $7,000 | $21,090 |
| 2017 | $1,122 | $30,010 | $7,000 | $23,010 |
| 2016 | $1,093 | $30,010 | $7,000 | $23,010 |
| 2015 | $1,088 | $28,980 | $7,000 | $21,980 |
| 2014 | $1,036 | $28,980 | $7,000 | $21,980 |
| 2013 | $1,036 | $28,980 | $7,000 | $21,980 |
Source: Public Records
Map
Nearby Homes
- 935 Elizabeth Dr
- 221 S Baker Ave
- 130 Boving Rd
- 114-116 S Cedar Ave
- 122 S Cedar Ave
- 1511 Cedar Hill Rd
- 147 S Roosevelt Ave
- 914 W Hubert Ave
- 161 Cedar Hill Rd
- 819 Spring St
- 308 Hunter Ave
- 720 W Hubert Ave
- 0 Highland Ave
- 224 Harrison Ave
- 323 Garfield Ave
- 1643 W Mulberry St
- 404 Garfield Ave
- 1721 Union St
- 1829 Shoshone Dr
- 1821 Shoshone Dr
- 413 Williamsburg Ln NW
- 413 Williamsburg Ln NW Unit H
- 413 Williamsburg Ln NW Unit C
- 413 Williamsburg Ln NW Unit A
- 413 Williamsburg Ln NW Unit B
- 413 Williamsburg Ln NW
- 413 Williamsburg Ln NW
- 413 Williamsburg Ln NW Unit 14E
- 413 Williamsburg Ln NW Unit 14D
- 413 Williamsburg Ln NW
- 413 Williamsburg Ln NW
- 413 Williamsburg Ln NW Unit H
- 413 Williamsburg Ln NW Unit B
- 413 Williamsburg Ln NW Unit A
- 413 Williamsburg Ln NW Unit E
- 413 Williamsburg Ln NW Unit F
- 417 Williamsburg Ln Unit H
- 413 Williamsburg Ln NW
- 431 Williamsburg Ln NW
- 418 Williamsburg Ln NW