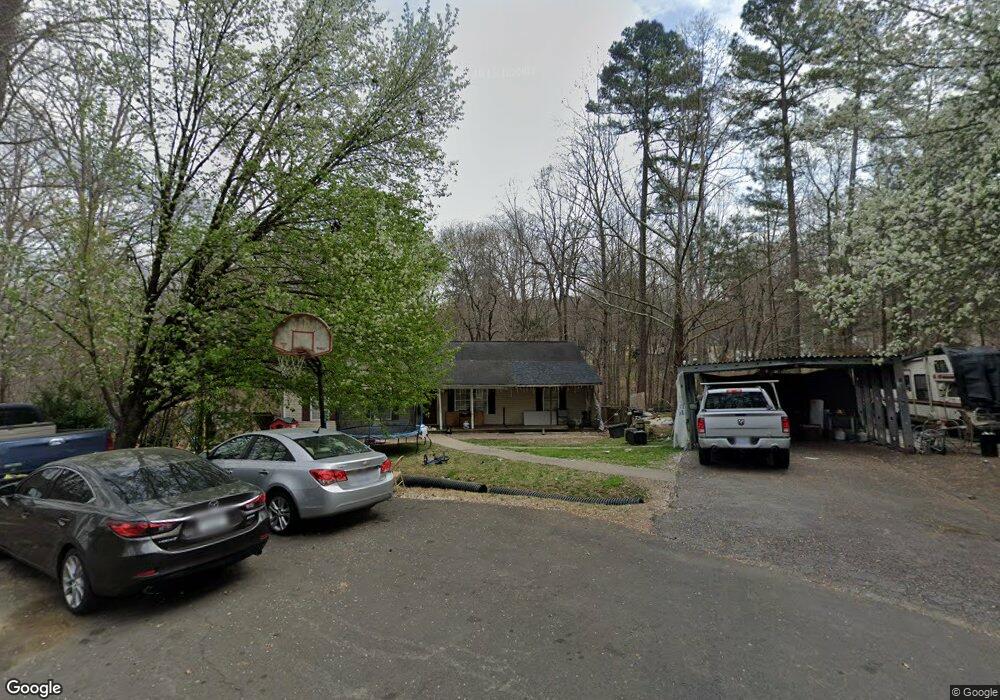
4130 Chaucer Dr Durham, NC 27705
Estimated Value: $332,000 - $367,000
4
Beds
2
Baths
1,542
Sq Ft
$226/Sq Ft
Est. Value
About This Home
This home is located at 4130 Chaucer Dr, Durham, NC 27705 and is currently estimated at $348,538, approximately $226 per square foot. 4130 Chaucer Dr is a home located in Durham County with nearby schools including Easley Elementary, George L Carrington Middle, and Riverside High School.
Ownership History
Date
Name
Owned For
Owner Type
Purchase Details
Closed on
Mar 18, 2005
Sold by
Bank Of New York
Bought by
Garcia Martin Vargas and Martines Lourdes Delgado
Current Estimated Value
Home Financials for this Owner
Home Financials are based on the most recent Mortgage that was taken out on this home.
Original Mortgage
$127,027
Outstanding Balance
$64,229
Interest Rate
5.57%
Mortgage Type
FHA
Estimated Equity
$284,309
Purchase Details
Closed on
Jan 24, 2005
Sold by
Clark Javonne and Clark Charlene
Bought by
Bank Of New York
Home Financials for this Owner
Home Financials are based on the most recent Mortgage that was taken out on this home.
Original Mortgage
$127,027
Outstanding Balance
$64,229
Interest Rate
5.57%
Mortgage Type
FHA
Estimated Equity
$284,309
Purchase Details
Closed on
Nov 29, 2000
Sold by
Jenkins Frances J
Bought by
Clark Javonne and Clark Charlene
Home Financials for this Owner
Home Financials are based on the most recent Mortgage that was taken out on this home.
Original Mortgage
$130,050
Interest Rate
7.82%
Create a Home Valuation Report for This Property
The Home Valuation Report is an in-depth analysis detailing your home's value as well as a comparison with similar homes in the area
Home Values in the Area
Average Home Value in this Area
Purchase History
| Date | Buyer | Sale Price | Title Company |
|---|---|---|---|
| Garcia Martin Vargas | $128,500 | -- | |
| Bank Of New York | $157,811 | -- | |
| Clark Javonne | $15,000 | -- |
Source: Public Records
Mortgage History
| Date | Status | Borrower | Loan Amount |
|---|---|---|---|
| Open | Garcia Martin Vargas | $127,027 | |
| Previous Owner | Clark Javonne | $130,050 |
Source: Public Records
Tax History Compared to Growth
Tax History
| Year | Tax Paid | Tax Assessment Tax Assessment Total Assessment is a certain percentage of the fair market value that is determined by local assessors to be the total taxable value of land and additions on the property. | Land | Improvement |
|---|---|---|---|---|
| 2025 | $2,678 | $387,951 | $159,300 | $228,651 |
| 2024 | $2,678 | $191,958 | $44,350 | $147,608 |
| 2023 | $2,514 | $191,958 | $44,350 | $147,608 |
| 2022 | $2,457 | $191,958 | $44,350 | $147,608 |
| 2021 | $2,445 | $191,958 | $44,350 | $147,608 |
| 2020 | $2,388 | $191,958 | $44,350 | $147,608 |
| 2019 | $2,388 | $191,958 | $44,350 | $147,608 |
| 2018 | $1,983 | $146,156 | $31,045 | $115,111 |
| 2017 | $1,968 | $146,156 | $31,045 | $115,111 |
| 2016 | $1,902 | $146,156 | $31,045 | $115,111 |
| 2015 | $2,148 | $155,142 | $31,998 | $123,144 |
| 2014 | $2,148 | $155,142 | $31,998 | $123,144 |
Source: Public Records
Map
Nearby Homes
- 4028 Chaucer Dr
- 2905 Reynolda Cir
- 16 Daly Ct
- 1409 Nicklaus Dr
- 1139 Sawmill Ln
- 1143 Sawmill Ln
- 4908 Mandel Rd
- 3047 Rosewood Cir
- 3107 Rosebriar Dr
- 1813 Grady Dr
- 5026 Gatewood Dr
- 5023 Pine Trail Dr
- 1 Signet Dr Unit A17
- 2009 Eden Shire Way
- 3228 Rose of Sharon Rd
- 1601 Redmond Dr
- 2801 Warren St
- 208 Latta Rd
- 3775 Guess Rd Unit 43
- 2808 Maple Ridge Dr
- 4126 Chaucer Dr
- 4133 Trevor Cir
- 4122 Chaucer Dr
- 4129 Trevor Cir
- 4125 Trevor Cir
- 4125 Chaucer Dr
- 4121 Trevor Cir
- 4118 Chaucer Dr
- 4117 Trevor Cir
- 4121 Chaucer Dr
- 4113 Trevor Cir
- 4114 Chaucer Dr
- 4117 Chaucer Dr
- 4132 Trevor Cir
- 4109 Trevor Cir
- 4112 Trevor Cir
- 4128 Trevor Cir
- 4136 Trevor Cir
- 4115 Chaucer Dr
- 4110 Chaucer Dr