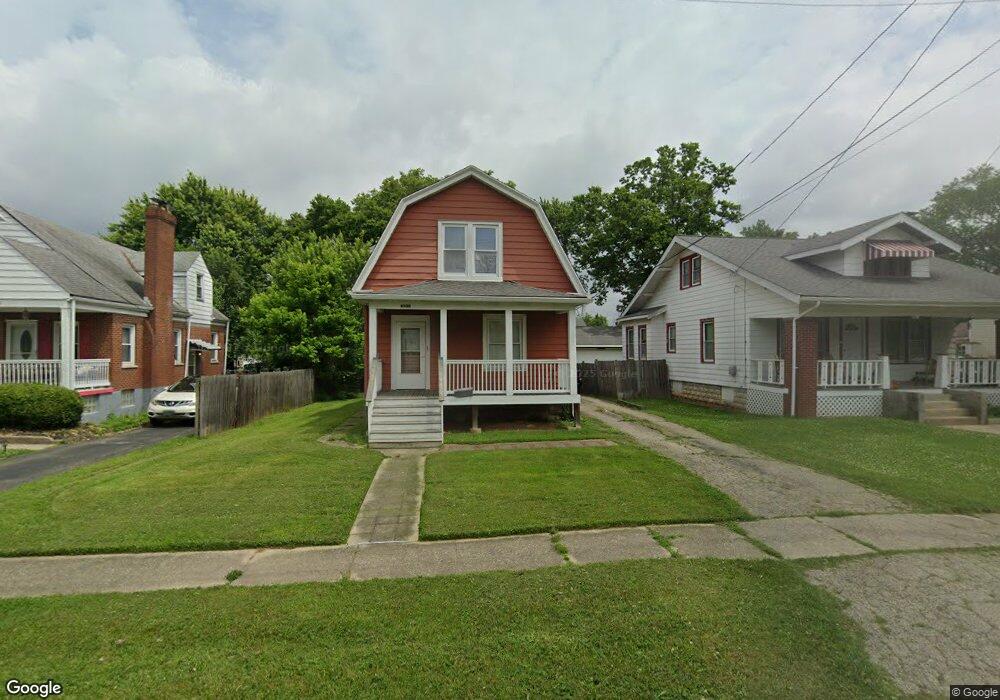
4130 Lansdowne Ave Cincinnati, OH 45236
Estimated Value: $169,000 - $240,000
2
Beds
1
Bath
1,322
Sq Ft
$164/Sq Ft
Est. Value
About This Home
This home is located at 4130 Lansdowne Ave, Cincinnati, OH 45236 and is currently estimated at $216,865, approximately $164 per square foot. 4130 Lansdowne Ave is a home located in Hamilton County with nearby schools including Amity Elementary School, Deer Park Jr/Sr High School, and Ohr Torah Cincinnati.
Ownership History
Date
Name
Owned For
Owner Type
Purchase Details
Closed on
Jul 26, 2011
Sold by
Burnett Jennifer A
Bought by
Carr Michael A
Current Estimated Value
Home Financials for this Owner
Home Financials are based on the most recent Mortgage that was taken out on this home.
Original Mortgage
$63,000
Outstanding Balance
$42,912
Interest Rate
4.53%
Mortgage Type
New Conventional
Estimated Equity
$173,953
Purchase Details
Closed on
Mar 27, 2001
Sold by
Terretti Geraldine
Bought by
Hutzel Matthew A and Hutzel Gretchen M
Home Financials for this Owner
Home Financials are based on the most recent Mortgage that was taken out on this home.
Original Mortgage
$75,000
Interest Rate
7.13%
Purchase Details
Closed on
Mar 19, 2001
Sold by
Estate Of Fred Terretti
Bought by
Terretti Geraldine
Home Financials for this Owner
Home Financials are based on the most recent Mortgage that was taken out on this home.
Original Mortgage
$75,000
Interest Rate
7.13%
Create a Home Valuation Report for This Property
The Home Valuation Report is an in-depth analysis detailing your home's value as well as a comparison with similar homes in the area
Home Values in the Area
Average Home Value in this Area
Purchase History
| Date | Buyer | Sale Price | Title Company |
|---|---|---|---|
| Carr Michael A | $90,000 | Attorney | |
| Hutzel Matthew A | $79,000 | -- | |
| Terretti Geraldine | -- | -- |
Source: Public Records
Mortgage History
| Date | Status | Borrower | Loan Amount |
|---|---|---|---|
| Open | Carr Michael A | $63,000 | |
| Previous Owner | Hutzel Matthew A | $75,000 |
Source: Public Records
Tax History
| Year | Tax Paid | Tax Assessment Tax Assessment Total Assessment is a certain percentage of the fair market value that is determined by local assessors to be the total taxable value of land and additions on the property. | Land | Improvement |
|---|---|---|---|---|
| 2025 | $3,524 | $48,206 | $11,921 | $36,285 |
| 2024 | $2,952 | $48,206 | $11,921 | $36,285 |
| 2023 | $3,009 | $48,206 | $11,921 | $36,285 |
| 2022 | $2,925 | $36,120 | $9,709 | $26,411 |
| 2021 | $2,863 | $36,120 | $9,709 | $26,411 |
| 2020 | $2,648 | $36,120 | $9,709 | $26,411 |
| 2019 | $2,676 | $32,837 | $8,827 | $24,010 |
| 2018 | $2,677 | $32,837 | $8,827 | $24,010 |
| 2017 | $2,548 | $32,837 | $8,827 | $24,010 |
| 2016 | $2,375 | $30,244 | $8,803 | $21,441 |
| 2015 | $2,170 | $30,244 | $8,803 | $21,441 |
| 2014 | $2,170 | $30,244 | $8,803 | $21,441 |
| 2013 | $2,359 | $32,519 | $9,464 | $23,055 |
Source: Public Records
Map
Nearby Homes
- 4106 Orchard Ln
- 4050 O'Leary Ave
- 4123 Hoffman Ave
- 3990 Superior Ave
- 4300 Hegner Ave
- 4025 Deer Park Ave
- 8021 Beech Ave
- 7719 Dearborn Ave
- 4248 South Ave
- 8095 Camner Ave
- 13 Wentworth Ln
- 7873 Gail Dr
- 4305 Myrtle Ave
- 34 Wentworth Ln
- 42 Wentworth Ln
- 6008 Winnetka Dr
- 6829 Alpine Ave
- 5635 Euclid Rd
- 8390 Wexford Ave
- 4304 Kugler Mill Rd
- 4126 Lansdowne Ave
- 4134 Lansdowne Ave
- 4122 Lansdowne Ave
- 4138 Lansdowne Ave
- 4127 O Leary Ave
- 4120 Lansdowne Ave
- 4140 Lansdowne Ave
- 4125 O'Leary Ave
- 4129 O Leary Ave
- 4125 O Leary Ave
- 4129 O'Leary Ave
- 4121 O'Leary Ave
- 4131 O Leary Ave
- 4121 O Leary Ave
- 4129 Lansdowne Ave
- 4142 Lansdowne Ave
- 4116 Lansdowne Ave
- 4125 Lansdowne Ave
- 4133 Lansdowne Ave
- 4117 O'Leary Ave
Your Personal Tour Guide
Ask me questions while you tour the home.