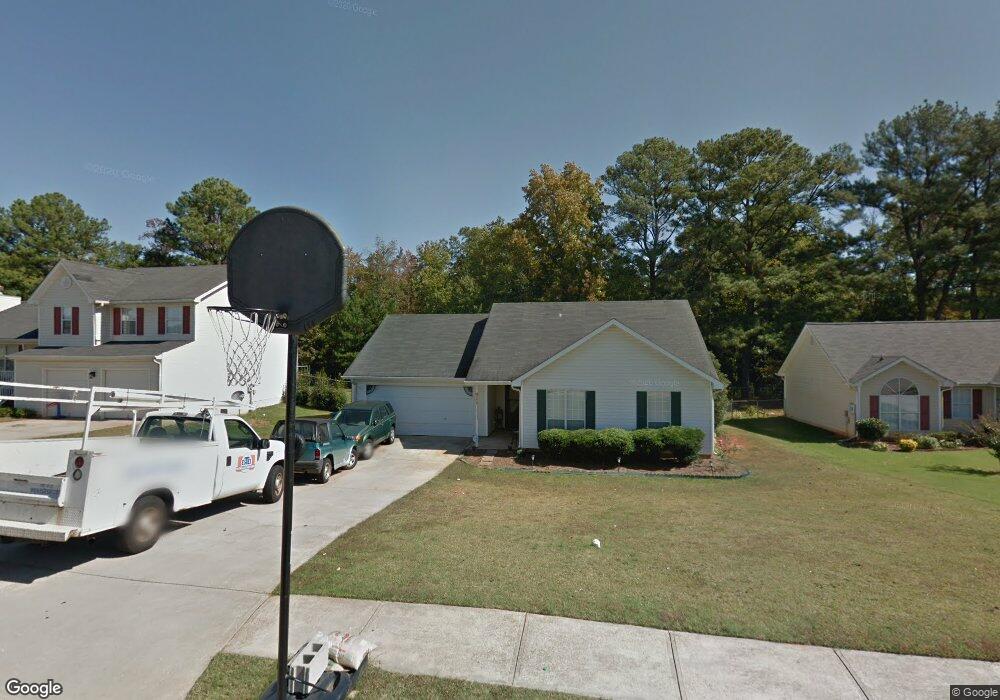
4130 Monarch Dr McDonough, AZ 30253
Estimated Value: $234,000 - $245,000
3
Beds
2
Baths
1,222
Sq Ft
$197/Sq Ft
Est. Value
About This Home
This home is located at 4130 Monarch Dr, McDonough, AZ 30253 and is currently estimated at $240,722, approximately $196 per square foot. 4130 Monarch Dr is a home located in Henry County with nearby schools including Walnut Creek Elementary School, McDonough Middle School, and Hickory Flat Elementary School.
Ownership History
Date
Name
Owned For
Owner Type
Purchase Details
Closed on
Apr 11, 2024
Sold by
Sfr Investments V Borrower 1 Llc
Bought by
Progress Residential Borrower 25 Llc
Current Estimated Value
Purchase Details
Closed on
Jun 23, 2021
Sold by
Atl 3 Sf Llc
Bought by
Sfr Investments V Borrower 1 Llc
Purchase Details
Closed on
Sep 30, 2015
Sold by
Attanasio Gary
Bought by
Atl 2 Sf Llc
Purchase Details
Closed on
May 14, 2001
Sold by
Lee Tina M
Bought by
Matthews Donna
Home Financials for this Owner
Home Financials are based on the most recent Mortgage that was taken out on this home.
Original Mortgage
$92,900
Interest Rate
6.98%
Mortgage Type
New Conventional
Purchase Details
Closed on
Nov 25, 1997
Sold by
Gasses Raymond J and Rjg Builders
Bought by
Lee Tina M
Home Financials for this Owner
Home Financials are based on the most recent Mortgage that was taken out on this home.
Original Mortgage
$82,150
Interest Rate
7.38%
Mortgage Type
New Conventional
Create a Home Valuation Report for This Property
The Home Valuation Report is an in-depth analysis detailing your home's value as well as a comparison with similar homes in the area
Home Values in the Area
Average Home Value in this Area
Purchase History
| Date | Buyer | Sale Price | Title Company |
|---|---|---|---|
| Progress Residential Borrower 25 Llc | -- | -- | |
| Sfr Investments V Borrower 1 Llc | $10,068,212 | -- | |
| Atl 2 Sf Llc | $100,000 | -- | |
| Matthews Donna | $103,300 | -- | |
| Lee Tina M | $86,500 | -- |
Source: Public Records
Mortgage History
| Date | Status | Borrower | Loan Amount |
|---|---|---|---|
| Previous Owner | Matthews Donna | $92,900 | |
| Previous Owner | Lee Tina M | $82,150 |
Source: Public Records
Tax History Compared to Growth
Tax History
| Year | Tax Paid | Tax Assessment Tax Assessment Total Assessment is a certain percentage of the fair market value that is determined by local assessors to be the total taxable value of land and additions on the property. | Land | Improvement |
|---|---|---|---|---|
| 2025 | $3,502 | $93,720 | $14,018 | $79,702 |
| 2024 | $3,502 | $93,720 | $14,000 | $79,720 |
| 2023 | $3,509 | $93,400 | $11,200 | $82,200 |
| 2022 | $2,875 | $74,680 | $11,200 | $63,480 |
| 2021 | $2,229 | $56,560 | $11,200 | $45,360 |
| 2020 | $2,067 | $52,120 | $10,000 | $42,120 |
| 2019 | $2,019 | $49,440 | $10,000 | $39,440 |
| 2018 | $1,800 | $44,000 | $8,000 | $36,000 |
| 2016 | $1,554 | $37,440 | $7,200 | $30,240 |
| 2015 | -- | $33,520 | $7,200 | $26,320 |
| 2014 | $1,218 | $28,520 | $6,000 | $22,520 |
Source: Public Records
Map
Nearby Homes
- 7000 Regency Ln
- 4170 Monarch Dr
- 7011 Regency Ln
- 7030 Kingston Ln
- 90 Cabriolet Trail
- 271 Spring Creek Blvd
- 121 Pinnacle Ln
- 415 Gracious Way
- 1244 Faye Ct
- 360 Atlanta St
- 204 Rankin Cir
- 101 Pinnacle Ln
- 224 Prominent Loop
- 0 Ivey Edwards Ln Unit 10409448
- 0 Ivey Edwards Ln Unit 10246400
- 409 Hyder Ct
- 117 Tracy Ln
- 297 Decatur Rd
- 280 Burke Cir
- 685 Highway 155 N
- 4130 Monarch Dr
- 4140 Monarch Dr
- 4120 Monarch Dr
- 4150 Monarch Dr
- 4110 Monarch Dr
- 6000 Kingston Ln
- 6051 Ambassador Dr
- 4160 Monarch Dr
- 4100 Monarch Dr
- 6010 Kingston Ln
- 6041 Ambassador Dr
- 6001 Kingston Ln
- 0 Monarch Dr Unit 7404844
- 0 Monarch Dr Unit 7007536
- 0 Monarch Dr Unit 7005700
- 0 Monarch Dr Unit 7296297
- 0 Monarch Dr Unit 8487125
- 0 Monarch Dr Unit 7478675
- 0 Monarch Dr Unit 7622137
- 0 Monarch Dr