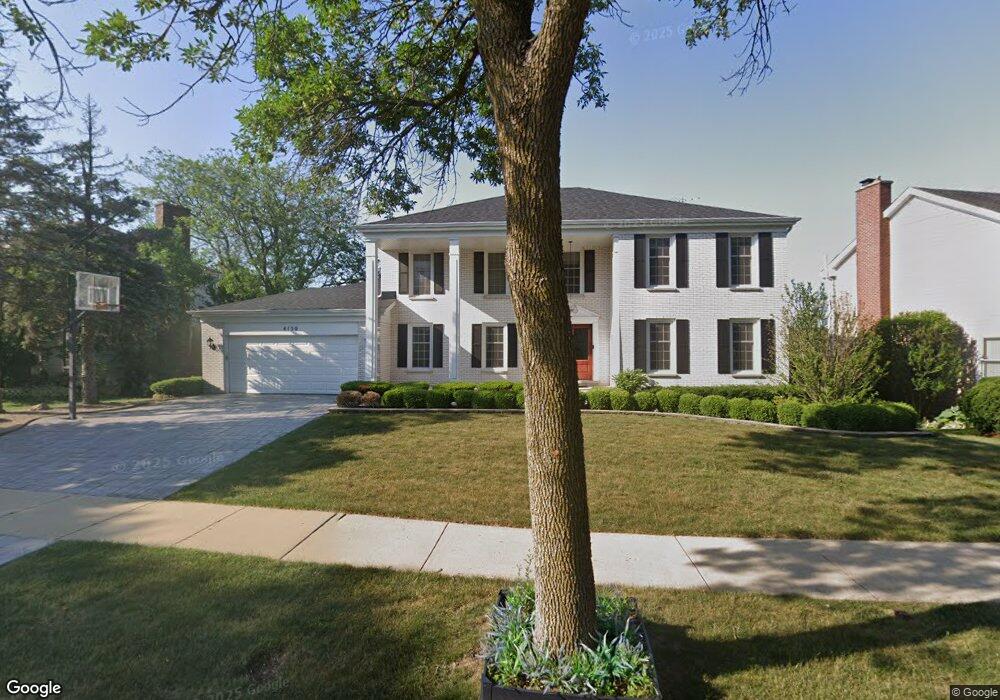
4130 N Terramere Ave Arlington Heights, IL 60004
Terramere NeighborhoodEstimated Value: $753,000 - $845,000
5
Beds
3
Baths
3,121
Sq Ft
$258/Sq Ft
Est. Value
About This Home
This home is located at 4130 N Terramere Ave, Arlington Heights, IL 60004 and is currently estimated at $803,668, approximately $257 per square foot. 4130 N Terramere Ave is a home located in Cook County with nearby schools including Henry W Longfellow Elementary School, Cooper Middle School, and Buffalo Grove High School.
Ownership History
Date
Name
Owned For
Owner Type
Purchase Details
Closed on
Sep 28, 2007
Sold by
Landuyt Richard W and Landuyt Gayle A
Bought by
Landuyt Gayle A and Gayle A Landuyt Trust
Current Estimated Value
Purchase Details
Closed on
Nov 29, 1995
Sold by
Nbd Bank
Bought by
Anderson Kenneth S and Andeson Alicia L
Purchase Details
Closed on
Nov 29, 1993
Sold by
Jain Ganpat M and Jain Madhu
Bought by
Landuyt Richard M and Landuyt Gayle A
Create a Home Valuation Report for This Property
The Home Valuation Report is an in-depth analysis detailing your home's value as well as a comparison with similar homes in the area
Home Values in the Area
Average Home Value in this Area
Purchase History
| Date | Buyer | Sale Price | Title Company |
|---|---|---|---|
| Landuyt Gayle A | -- | None Available | |
| Anderson Kenneth S | -- | -- | |
| Landuyt Richard M | $250,000 | -- |
Source: Public Records
Tax History Compared to Growth
Tax History
| Year | Tax Paid | Tax Assessment Tax Assessment Total Assessment is a certain percentage of the fair market value that is determined by local assessors to be the total taxable value of land and additions on the property. | Land | Improvement |
|---|---|---|---|---|
| 2024 | $18,490 | $59,000 | $13,891 | $45,109 |
| 2023 | $17,622 | $59,000 | $13,891 | $45,109 |
| 2022 | $17,622 | $59,000 | $13,891 | $45,109 |
| 2021 | $18,483 | $53,429 | $9,168 | $44,261 |
| 2020 | $17,990 | $53,429 | $9,168 | $44,261 |
| 2019 | $17,988 | $59,038 | $9,168 | $49,870 |
| 2018 | $18,495 | $54,380 | $8,056 | $46,324 |
| 2017 | $17,027 | $54,380 | $8,056 | $46,324 |
| 2016 | $16,197 | $54,380 | $8,056 | $46,324 |
| 2015 | $13,858 | $43,461 | $6,945 | $36,516 |
| 2014 | $15,528 | $49,006 | $6,945 | $42,061 |
| 2013 | $14,419 | $49,006 | $6,945 | $42,061 |
Source: Public Records
Map
Nearby Homes
- 811 W Nichols Rd
- 812 W Whiting Ln
- 715 W Whiting Ln
- 4121 N Mallard Dr Unit 5
- 715 W Happfield Dr
- 1631 W Partridge Ct Unit 8
- 751 W Happfield Dr Unit 30
- 921 Bernard Dr
- 705 Grove Dr Unit 101
- 1112 Auburn Ln
- 1854 Checker Rd
- 1942 Trail Ridge St
- 859 Beechwood Rd
- 571 Estate Dr
- 720 Weidner Rd Unit 302
- 535 Estate Dr
- 872 Old Checker Rd Unit E3
- 1545 Chickamauga Ln
- 2245 Nichols Rd Unit C
- 2044 N Ginger Creek Dr Unit 30C
- 4134 N Terramere Ave
- 4124 N Terramere Ave
- 4148 N Terramere Ave
- 4120 N Terramere Ave
- 710 W Burkitt Place
- 4141 N Terramere Ave
- 4145 N Terramere Ave
- 4152 N Terramere Ave
- 4149 N Terramere Ave Unit 1
- 4109 N Salem Dr
- 4127 N Terramere Ave
- 4210 N Ridge Ave
- 702 W Burkitt Place
- 4218 N Ridge Ave
- 4112 N Terramere Ave
- 4214 N Ridge Ave
- 4156 N Terramere Ave
- 703 W Burkitt Place
- 4123 N Terramere Ave
- 4207 N Salem Dr