Estimated Value: $604,000 - $673,829
4
Beds
4
Baths
2,952
Sq Ft
$218/Sq Ft
Est. Value
About This Home
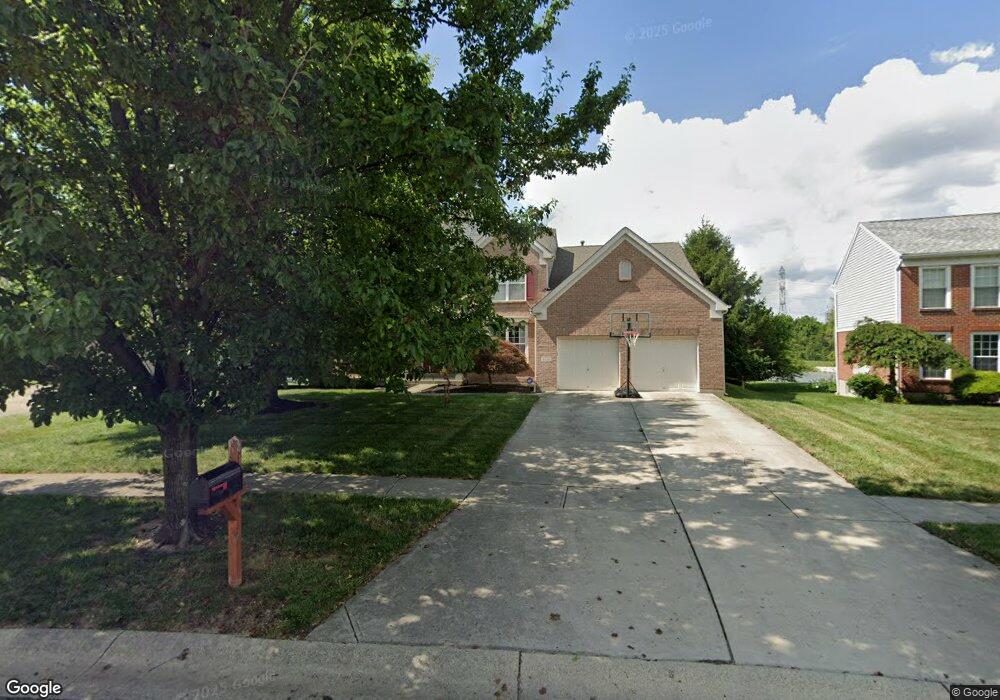
This home is located at 4130 S Shore Dr, Mason, OH 45040 and is currently estimated at $644,207, approximately $218 per square foot. 4130 S Shore Dr is a home located in Warren County with nearby schools including Mason Intermediate Elementary School, Mason Middle School, and William Mason High School.
Ownership History
Date
Name
Owned For
Owner Type
Purchase Details
Closed on
Aug 19, 2016
Sold by
Wilson Adam F and Wilson Mikah C
Bought by
Parkins Jason and Parkins Irina S
Current Estimated Value
Home Financials for this Owner
Home Financials are based on the most recent Mortgage that was taken out on this home.
Original Mortgage
$314,100
Outstanding Balance
$250,372
Interest Rate
3.45%
Mortgage Type
New Conventional
Estimated Equity
$393,835
Purchase Details
Closed on
Oct 18, 2000
Sold by
Fischer Family Homes Ltd
Bought by
Snyder Kevin M and Snyder Tracy A
Home Financials for this Owner
Home Financials are based on the most recent Mortgage that was taken out on this home.
Original Mortgage
$240,000
Interest Rate
7.96%
Mortgage Type
New Conventional
Purchase Details
Closed on
Oct 15, 1998
Sold by
Al & Char Ltd Ptns
Bought by
Schuholz A John
Create a Home Valuation Report for This Property
The Home Valuation Report is an in-depth analysis detailing your home's value as well as a comparison with similar homes in the area
Home Values in the Area
Average Home Value in this Area
Purchase History
| Date | Buyer | Sale Price | Title Company |
|---|---|---|---|
| Parkins Jason | $342,000 | Attorney | |
| Snyder Kevin M | $307,544 | -- | |
| Schuholz A John | $30,000 | -- |
Source: Public Records
Mortgage History
| Date | Status | Borrower | Loan Amount |
|---|---|---|---|
| Open | Parkins Jason | $314,100 | |
| Previous Owner | Snyder Kevin M | $240,000 |
Source: Public Records
Tax History Compared to Growth
Tax History
| Year | Tax Paid | Tax Assessment Tax Assessment Total Assessment is a certain percentage of the fair market value that is determined by local assessors to be the total taxable value of land and additions on the property. | Land | Improvement |
|---|---|---|---|---|
| 2024 | $7,871 | $184,050 | $46,200 | $137,850 |
| 2023 | $7,359 | $141,855 | $24,780 | $117,075 |
| 2022 | $7,232 | $141,855 | $24,780 | $117,075 |
| 2021 | $6,879 | $141,855 | $24,780 | $117,075 |
| 2020 | $6,864 | $120,215 | $21,000 | $99,215 |
| 2019 | $6,361 | $120,215 | $21,000 | $99,215 |
| 2018 | $6,348 | $120,215 | $21,000 | $99,215 |
| 2017 | $5,919 | $102,736 | $18,977 | $83,759 |
| 2016 | $6,085 | $102,736 | $18,977 | $83,759 |
| 2015 | $6,061 | $102,736 | $18,977 | $83,759 |
| 2014 | $5,657 | $88,560 | $16,360 | $72,210 |
| 2013 | $5,669 | $113,690 | $21,000 | $92,690 |
Source: Public Records
Map
Nearby Homes
- 7609 Mansion Cir
- 7601 Mansion Cir
- 7489 Mansion Cir
- 4251 S Shore Dr
- 4320 Crystal Ct
- 4321 N Shore Dr
- 4344 N Point Dr
- 4344 N Point Ct Unit 202
- 4344 North Point
- 7754 Cove View Dr
- 4451 N Shore Dr
- 4487 N Shore Dr
- 4379 English Oak Ct Unit 38302
- 4027 Meadow Grove Ln
- 4431 English Oak Ct
- 4467 English Oak Ct
- 7362 Middleton Way
- 4465 Black Oak Ln
- 4447 Hyacinth Dr
- 8074 Big Oak Cir
- 4120 S Shore Dr
- 4142 S Shore Dr
- 4156 S Shore Dr
- 4102 S Shore Dr
- 4147 S Shore Dr
- 4013 S Shore Dr
- 4172 S Shore Dr
- 4082 S Shore Dr
- 4082 S Shore Dr
- 4082 S Shore
- 4163 S Shore Dr
- 7668 E Bay Dr
- 4066 S Shore Dr
- 4192 S Shore Dr
- 4085 S Shore Dr
- 4177 S Shore Dr
- 7692 E Bay Dr
- 7701 E Bay Dr
- 7623 Deer Crossing Dr
- 4206 S Shore Dr