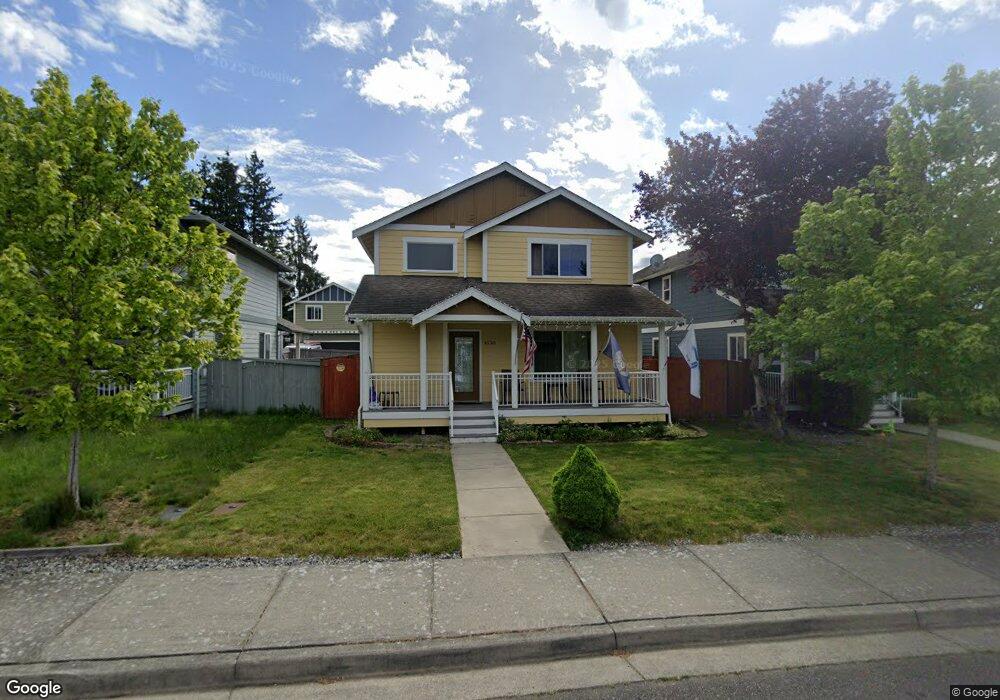
4130 Stonecrest Ct Bellingham, WA 98226
King Mountain NeighborhoodEstimated Value: $592,000 - $673,000
3
Beds
3
Baths
1,797
Sq Ft
$349/Sq Ft
Est. Value
About This Home
This home is located at 4130 Stonecrest Ct, Bellingham, WA 98226 and is currently estimated at $627,385, approximately $349 per square foot. 4130 Stonecrest Ct is a home with nearby schools including Cordata Elementary School, Shuksan Middle School, and Squalicum High School.
Ownership History
Date
Name
Owned For
Owner Type
Purchase Details
Closed on
Jul 25, 2007
Sold by
Alliance Properties 2000 Llc
Bought by
Crabtree Kevin D and Crabtree Norma L
Current Estimated Value
Home Financials for this Owner
Home Financials are based on the most recent Mortgage that was taken out on this home.
Original Mortgage
$194,000
Outstanding Balance
$122,705
Interest Rate
6.73%
Mortgage Type
Unknown
Estimated Equity
$504,680
Create a Home Valuation Report for This Property
The Home Valuation Report is an in-depth analysis detailing your home's value as well as a comparison with similar homes in the area
Home Values in the Area
Average Home Value in this Area
Purchase History
| Date | Buyer | Sale Price | Title Company |
|---|---|---|---|
| Crabtree Kevin D | $259,280 | Stewart Title Company |
Source: Public Records
Mortgage History
| Date | Status | Borrower | Loan Amount |
|---|---|---|---|
| Open | Crabtree Kevin D | $194,000 |
Source: Public Records
Tax History Compared to Growth
Tax History
| Year | Tax Paid | Tax Assessment Tax Assessment Total Assessment is a certain percentage of the fair market value that is determined by local assessors to be the total taxable value of land and additions on the property. | Land | Improvement |
|---|---|---|---|---|
| 2024 | $4,388 | $540,023 | $211,408 | $328,615 |
| 2023 | $4,388 | $563,769 | $220,704 | $343,065 |
| 2022 | $3,796 | $494,534 | $193,600 | $300,934 |
| 2021 | $3,694 | $408,706 | $160,000 | $248,706 |
| 2020 | $3,606 | $375,286 | $101,251 | $274,035 |
| 2019 | $3,235 | $350,606 | $94,673 | $255,933 |
| 2018 | $3,346 | $314,467 | $84,923 | $229,544 |
| 2017 | $2,915 | $278,243 | $75,140 | $203,103 |
| 2016 | $2,672 | $252,835 | $68,380 | $184,455 |
| 2015 | $2,771 | $240,923 | $65,000 | $175,923 |
| 2014 | -- | $241,788 | $67,080 | $174,708 |
| 2013 | -- | $231,349 | $65,000 | $166,349 |
Source: Public Records
Map
Nearby Homes
- 4045 Irongate Rd
- 4058 Hammer Dr Unit B101
- 4122 Iron Gate Rd
- 4053 Hammer Dr
- 1975 Alpine Way
- 1631 Jills Ct Unit 4
- 1631 Jills Ct Unit 14
- 1631 Jills Ct Unit 13
- 1631 Jills Ct Unit 11
- 1631 Jills Ct Unit 3
- 1631 Jills Ct Unit 17
- 1631 Jills Ct Unit 15
- 1631 Jills Ct Unit 8
- 1631 Jills Ct Unit 12
- 1631 Jills Ct Unit 9
- 1631 Jills Ct Unit 5
- 1631 Jills Ct Unit 16
- 1629 Jills Ct Unit 6
- 1629 Jills Ct Unit 7
- 1629 Jills Ct Unit 4
- 4134 Stonecrest Ct
- 4126 Stone Crest
- 4138 Stonecrest Ln
- 4129 Stonecrest Ln
- 4142 Stonecrest Ln
- 4127 Stonecrest Ln
- 4133 Irongate Rd
- 4142 Stonecrest Ct
- 4137 Stonecrest Ln
- 4137 Irongate Rd
- 4135 Stonecrest Ct
- 4146 Stonecrest Ct
- 4141 Stonecrest Ln
- 4101 Stonecrest Ct
- 4107 Stonecrest Ct
- 4145 Stonecrest Ln
- 4124 Kramer Ln
- 4150 Stonecrest Ct
- 4121 Stonecrest Ct
- 4128 Kramer Ln