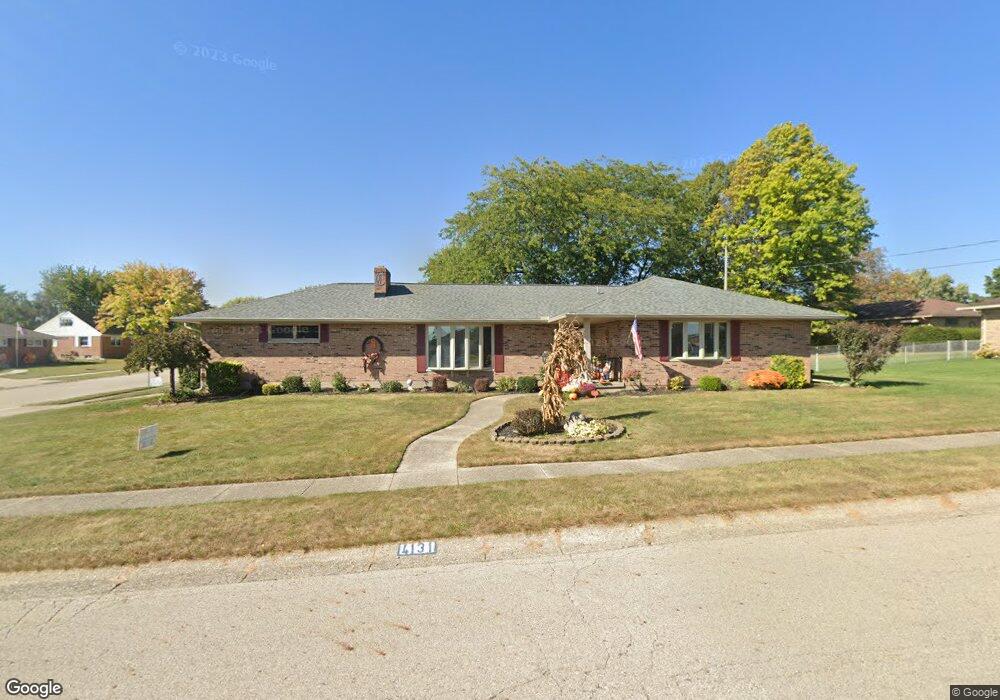
4131 Phoenix Dr Springfield, OH 45503
Estimated Value: $263,000 - $295,000
3
Beds
3
Baths
1,842
Sq Ft
$154/Sq Ft
Est. Value
About This Home
This home is located at 4131 Phoenix Dr, Springfield, OH 45503 and is currently estimated at $284,248, approximately $154 per square foot. 4131 Phoenix Dr is a home located in Clark County with nearby schools including Northridge Elementary School, Kenton Ridge Middle & High School, and Emmanuel Christian Academy.
Ownership History
Date
Name
Owned For
Owner Type
Purchase Details
Closed on
Jan 21, 2020
Sold by
Crall Chris E and Crall Deonna J
Bought by
Crall Chris E and Crall Deonna J
Current Estimated Value
Purchase Details
Closed on
Dec 1, 1982
Sold by
Jones Robert Emerson and Jones Helen
Bought by
Crall Chris E and Crall Deonna J
Create a Home Valuation Report for This Property
The Home Valuation Report is an in-depth analysis detailing your home's value as well as a comparison with similar homes in the area
Home Values in the Area
Average Home Value in this Area
Purchase History
We collect this data history from publicly available records. To have your information removed, we recommend requesting removal directly through your county’s website.
| Date | Buyer | Sale Price | Title Company |
|---|---|---|---|
| Crall Chris E | -- | None Available | |
| Crall Chris E | $61,000 | -- |
Source: Public Records
Tax History
| Year | Tax Paid | Tax Assessment Tax Assessment Total Assessment is a certain percentage of the fair market value that is determined by local assessors to be the total taxable value of land and additions on the property. | Land | Improvement |
|---|---|---|---|---|
| 2025 | $2,926 | $91,340 | $17,890 | $73,450 |
| 2024 | $2,830 | $66,910 | $11,970 | $54,940 |
| 2023 | $2,830 | $66,910 | $11,970 | $54,940 |
| 2022 | $2,840 | $66,910 | $11,970 | $54,940 |
| 2021 | $2,695 | $53,810 | $9,500 | $44,310 |
| 2020 | $2,697 | $53,810 | $9,500 | $44,310 |
| 2019 | $2,748 | $53,810 | $9,500 | $44,310 |
| 2018 | $2,517 | $47,290 | $8,520 | $38,770 |
| 2017 | $2,157 | $47,677 | $8,519 | $39,158 |
| 2016 | $2,142 | $47,677 | $8,519 | $39,158 |
| 2015 | $2,040 | $45,161 | $8,190 | $36,971 |
| 2014 | $2,040 | $45,161 | $8,190 | $36,971 |
| 2013 | $1,993 | $45,161 | $8,190 | $36,971 |
Source: Public Records
Map
Nearby Homes
- 4385 Helena Ct
- 4250 Midfield St
- 4512 Ridgewood Rd E
- 1415 Montego Dr
- 4028 Ryland Dr Unit 4028
- 1341 Student Ave
- 4642 Laredo St
- 1503 Kingsgate Rd
- 1505 Kingsgate Rd
- 4732 Lehigh Dr
- 4528 W Ridgewood Rd
- 1500 Kingsgate Rd Unit 19430
- 1502 Kingsgate Rd Unit 19432
- 1500 Kingsgate Rd
- 1502 Kingsgate Rd
- 1507 Kingsgate Rd
- 3631 Kingsgate Ln
- 4008 Bosart Rd
- 4898 Brannan Dr E
- 4917 Auston St
- 4138 Camelot Dr
- 4151 Phoenix Dr
- 4213 Nevada Rd
- 4134 Phoenix Dr
- 4150 Camelot Dr
- 4122 Phoenix Dr
- 4148 Phoenix Dr
- 4119 Phoenix Dr
- 4225 Nevada Rd
- 4139 Camelot Dr
- 4160 Phoenix Dr
- 4110 Phoenix Dr
- 4208 Camelot Dr
- 4149 Camelot Dr
- 4239 Nevada Rd
- 1916 Kimberly Cir
- 4109 Phoenix Dr
- 4181 Phoenix Dr
- 1922 Kimberly Cir
- 1908 Kimberly Cir
Your Personal Tour Guide
Ask me questions while you tour the home.