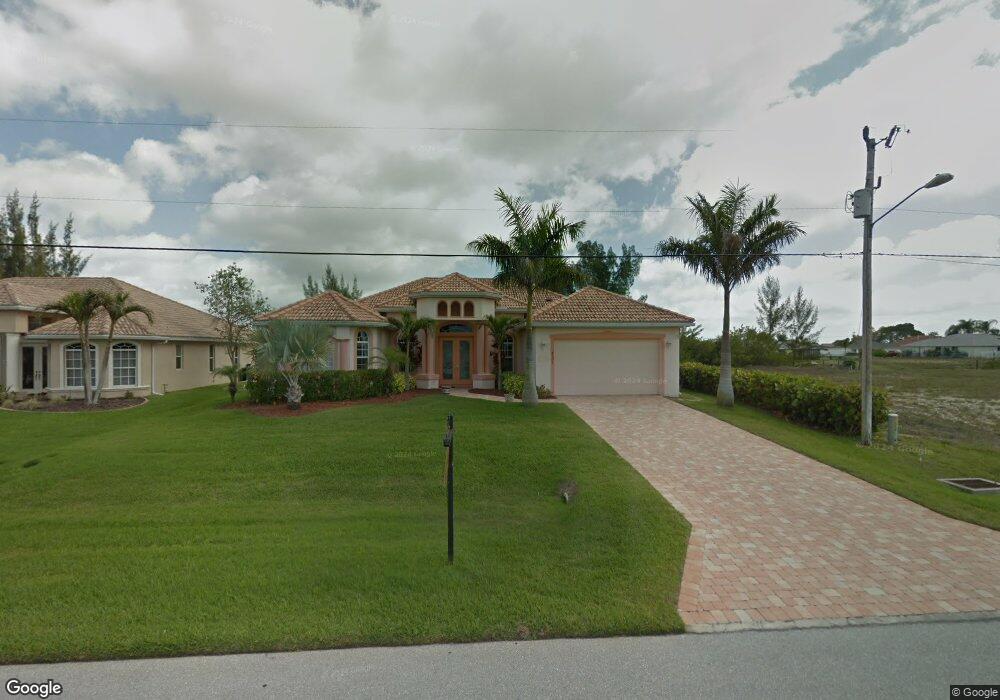
4131 SW 11th Ave Unit 65 Cape Coral, FL 33914
Pelican NeighborhoodEstimated Value: $691,000 - $1,401,000
3
Beds
3
Baths
2,604
Sq Ft
$372/Sq Ft
Est. Value
About This Home
This home is located at 4131 SW 11th Ave Unit 65, Cape Coral, FL 33914 and is currently estimated at $967,828, approximately $371 per square foot. 4131 SW 11th Ave Unit 65 is a home located in Lee County with nearby schools including Cape Elementary School, Caloosa Elementary School, and Tropic Isles Elementary School.
Ownership History
Date
Name
Owned For
Owner Type
Purchase Details
Closed on
Oct 16, 2013
Sold by
Williams Karen R
Bought by
Guby Eric and Guby Emily
Current Estimated Value
Home Financials for this Owner
Home Financials are based on the most recent Mortgage that was taken out on this home.
Original Mortgage
$415,500
Outstanding Balance
$311,199
Interest Rate
4.57%
Mortgage Type
New Conventional
Estimated Equity
$656,629
Purchase Details
Closed on
Apr 12, 2011
Sold by
Ferrara Vincent and Ferrara Donna
Bought by
Williams Karen R and Karen R Williams Trust
Purchase Details
Closed on
Jun 7, 2001
Sold by
Royal W Prop Inc
Bought by
Sanchez Ilio
Home Financials for this Owner
Home Financials are based on the most recent Mortgage that was taken out on this home.
Original Mortgage
$30,600
Interest Rate
7.05%
Create a Home Valuation Report for This Property
The Home Valuation Report is an in-depth analysis detailing your home's value as well as a comparison with similar homes in the area
Home Values in the Area
Average Home Value in this Area
Purchase History
| Date | Buyer | Sale Price | Title Company |
|---|---|---|---|
| Guby Eric | $535,000 | Best Title Solutions Inc | |
| Williams Karen R | $443,000 | Cape Coral Title Insurance A | |
| Sanchez Ilio | $34,000 | -- |
Source: Public Records
Mortgage History
| Date | Status | Borrower | Loan Amount |
|---|---|---|---|
| Open | Guby Eric | $415,500 | |
| Previous Owner | Sanchez Ilio | $30,600 |
Source: Public Records
Tax History Compared to Growth
Tax History
| Year | Tax Paid | Tax Assessment Tax Assessment Total Assessment is a certain percentage of the fair market value that is determined by local assessors to be the total taxable value of land and additions on the property. | Land | Improvement |
|---|---|---|---|---|
| 2025 | $7,095 | $444,907 | -- | -- |
| 2024 | $6,911 | $432,368 | -- | -- |
| 2023 | $6,911 | $419,775 | $0 | $0 |
| 2022 | $6,552 | $407,549 | $0 | $0 |
| 2021 | $6,818 | $502,546 | $143,397 | $359,149 |
| 2020 | $6,960 | $390,216 | $0 | $0 |
| 2019 | $6,772 | $381,443 | $0 | $0 |
| 2018 | $6,786 | $374,331 | $0 | $0 |
| 2017 | $6,775 | $366,632 | $0 | $0 |
| 2016 | $6,643 | $382,010 | $135,049 | $246,961 |
| 2015 | $6,744 | $354,812 | $125,524 | $229,288 |
| 2014 | $8,356 | $385,292 | $119,161 | $266,131 |
| 2013 | -- | $330,026 | $103,772 | $226,254 |
Source: Public Records
Map
Nearby Homes
- 4145 SW 10th Ave
- 1115 SW 42nd St
- 4219 SW 10th Ave
- 4144 SW 9th Place
- 1103 SW 41st Terrace
- 4107 SW 11th Ave
- 1130 SW 43rd St
- 4136 SW 9th Ave
- 4209 SW 9th Ave
- 4013 SW 11th Ave
- 4118 SW 8th Ct
- 4334 SW 9th Place
- 1109 SW 44th St
- 1012 Mohawk Pkwy
- 1140 SW 40th Terrace
- 4113 SW 8th Ct
- 2422 SW 11th Ave
- 2418 SW 11th Ave
- 4403 SW 10th Ave
- 4137 SW 8th Place
- 4127 SW 11th Ave
- 824 SW 42nd St
- 0 SW 42nd St Unit 60033375
- 830 SW 42nd St
- 832 SW 42nd St
- 0 SW 42nd St Unit 30190162
- 834 SW 42nd St
- 806 SW 42nd St
- 0 SW 42nd St Unit 30184737
- 0 SW 42nd St
- 826 SW 42nd St
- 4205 SW 11th Ave
- 1103 SW 42nd St
- 1102 SW 42nd St Unit 28
- 4128 SW 10th Ave
- 4132 SW 10th Ave
- 4119 SW 11th Ave
- 1102 SW 41st Terrace
- 4136 SW 10th Ave
- 1107 SW 42nd St