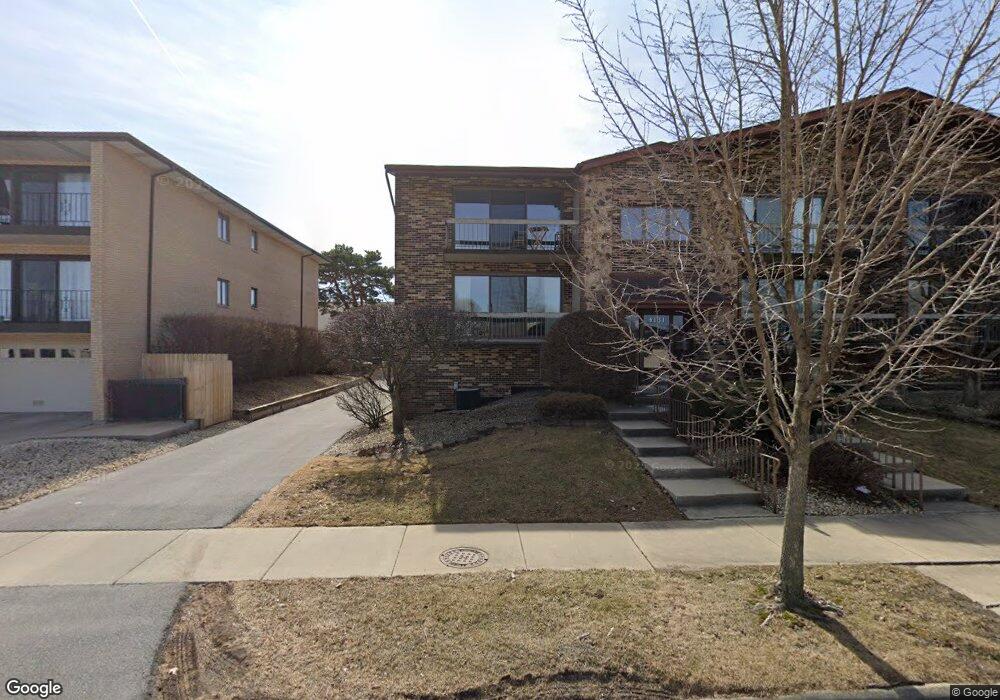
4131 W 93rd Place Unit 41311W Oak Lawn, IL 60453
Estimated Value: $188,061 - $234,000
2
Beds
2
Baths
1,659
Sq Ft
$124/Sq Ft
Est. Value
About This Home
This home is located at 4131 W 93rd Place Unit 41311W, Oak Lawn, IL 60453 and is currently estimated at $206,265, approximately $124 per square foot. 4131 W 93rd Place Unit 41311W is a home located in Cook County with nearby schools including Hometown Elementary School, Sward Elementary School, and J Covington Elementary School.
Ownership History
Date
Name
Owned For
Owner Type
Purchase Details
Closed on
Oct 18, 2013
Sold by
Powers James
Bought by
Osobu Monisola D
Current Estimated Value
Home Financials for this Owner
Home Financials are based on the most recent Mortgage that was taken out on this home.
Original Mortgage
$64,000
Outstanding Balance
$48,773
Interest Rate
4.87%
Mortgage Type
New Conventional
Estimated Equity
$157,492
Purchase Details
Closed on
Apr 12, 2000
Sold by
Old Kent Bank
Bought by
Jasper Merle F and Jasper Margaret K
Home Financials for this Owner
Home Financials are based on the most recent Mortgage that was taken out on this home.
Original Mortgage
$102,000
Interest Rate
6.75%
Purchase Details
Closed on
Mar 23, 1999
Sold by
Powers John F and Powers Hazel A
Bought by
Hazel A Powers Revocable Trust
Create a Home Valuation Report for This Property
The Home Valuation Report is an in-depth analysis detailing your home's value as well as a comparison with similar homes in the area
Home Values in the Area
Average Home Value in this Area
Purchase History
| Date | Buyer | Sale Price | Title Company |
|---|---|---|---|
| Osobu Monisola D | $80,000 | None Available | |
| Jasper Merle F | $127,500 | Ticor Title | |
| Hazel A Powers Revocable Trust | -- | -- |
Source: Public Records
Mortgage History
| Date | Status | Borrower | Loan Amount |
|---|---|---|---|
| Open | Osobu Monisola D | $64,000 | |
| Previous Owner | Jasper Merle F | $102,000 |
Source: Public Records
Tax History Compared to Growth
Tax History
| Year | Tax Paid | Tax Assessment Tax Assessment Total Assessment is a certain percentage of the fair market value that is determined by local assessors to be the total taxable value of land and additions on the property. | Land | Improvement |
|---|---|---|---|---|
| 2024 | $2,105 | $10,198 | $984 | $9,214 |
| 2023 | $1,278 | $10,198 | $984 | $9,214 |
| 2022 | $1,278 | $6,795 | $1,083 | $5,712 |
| 2021 | $1,283 | $6,793 | $1,082 | $5,711 |
| 2020 | $1,340 | $6,793 | $1,082 | $5,711 |
| 2019 | $2,433 | $10,137 | $984 | $9,153 |
| 2018 | $2,338 | $10,137 | $984 | $9,153 |
| 2017 | $2,363 | $10,137 | $984 | $9,153 |
| 2016 | $1,994 | $7,940 | $820 | $7,120 |
| 2015 | $1,926 | $7,940 | $820 | $7,120 |
| 2014 | $1,924 | $7,940 | $820 | $7,120 |
| 2013 | $3,035 | $9,433 | $820 | $8,613 |
Source: Public Records
Map
Nearby Homes
- 4025 W 93rd Place Unit 1E
- 4211 W 95th St Unit 1C
- 9226 S Harding Ave
- 9132 S Pulaski Rd Unit 2W
- 9516 S Kildare Ave Unit 2N
- 3900 W 95th St Unit 303
- 9601 S Karlov Ave Unit 104
- 9609 S Komensky Ave Unit 204
- 9523 S Kostner Ave
- 9321 S Avers Ave
- 9221 S Avers Ave
- 4153 W 89th Place Unit 1
- 4049 W 89th Place
- 4125 W 97th Place Unit 206
- 9725 S Karlov Ave Unit 402
- 9725 S Karlov Ave Unit 501
- 9725 S Karlov Ave Unit 401
- 9725 S Karlov Ave Unit 610
- 9338 S Ridgeway Ave
- 4530 W 93rd St Unit 2B
- 4131 W 93rd Place Unit 4131G1E
- 4131 W 93rd Place Unit 4131G2W
- 4131 W 93rd Place Unit 4131G1W
- 4131 W 93rd Place Unit 4131G2E
- 4131 W 93rd Place Unit 41311E
- 4131 W 93rd Place Unit 41312W
- 4131 W 93rd Place Unit 41312E
- 4131 W 93rd Place Unit 2E
- 4131 W 93rd Place Unit 2W
- 4135 W 93rd Place Unit 2W
- 4135 W 93rd Place Unit 41351W
- 4135 W 93rd Place Unit 41352W
- 4135 W 93rd Place Unit 41352E
- 4135 W 93rd Place Unit 41351E
- 4135 W 93rd Place Unit 4135G1W
- 4135 W 93rd Place Unit 4135G2W
- 4135 W 93rd Place Unit 4135G2E
- 4135 W 93rd Place Unit 4135G1E
- 4135 W 93rd Place Unit 2E