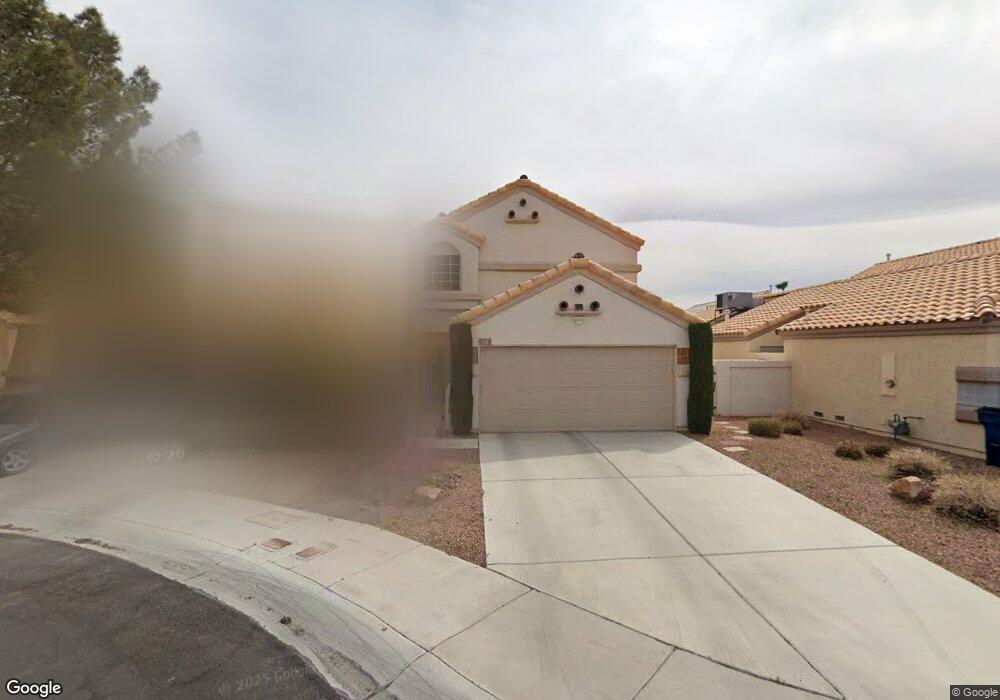
4132 Browndeer Cir Las Vegas, NV 89129
Lone Mountain NeighborhoodEstimated Value: $438,846 - $482,000
4
Beds
3
Baths
2,143
Sq Ft
$217/Sq Ft
Est. Value
About This Home
This home is located at 4132 Browndeer Cir, Las Vegas, NV 89129 and is currently estimated at $463,962, approximately $216 per square foot. 4132 Browndeer Cir is a home located in Clark County with nearby schools including Marc Kahre Elementary School, Dorothy Eisenberg Elementary School, and Justice Myron E Leavitt Middle School.
Ownership History
Date
Name
Owned For
Owner Type
Purchase Details
Closed on
Aug 29, 2019
Sold by
Barbour Nancy Elaine
Bought by
Barbour Nancy Elaine and Barbour 2019 Family Trust
Current Estimated Value
Purchase Details
Closed on
Mar 19, 2003
Sold by
Barbour Nancy E
Bought by
Barbour Nancy E
Home Financials for this Owner
Home Financials are based on the most recent Mortgage that was taken out on this home.
Original Mortgage
$88,300
Interest Rate
5.82%
Purchase Details
Closed on
Mar 9, 2001
Sold by
Barbour Scott A
Bought by
Barbour Nancy E
Home Financials for this Owner
Home Financials are based on the most recent Mortgage that was taken out on this home.
Original Mortgage
$93,000
Interest Rate
7.11%
Create a Home Valuation Report for This Property
The Home Valuation Report is an in-depth analysis detailing your home's value as well as a comparison with similar homes in the area
Home Values in the Area
Average Home Value in this Area
Purchase History
| Date | Buyer | Sale Price | Title Company |
|---|---|---|---|
| Barbour Nancy Elaine | -- | None Available | |
| Barbour Nancy E | -- | United Title Of Nevada | |
| Barbour Nancy E | -- | United Title |
Source: Public Records
Mortgage History
| Date | Status | Borrower | Loan Amount |
|---|---|---|---|
| Closed | Barbour Nancy E | $88,300 | |
| Closed | Barbour Nancy E | $93,000 |
Source: Public Records
Tax History Compared to Growth
Tax History
| Year | Tax Paid | Tax Assessment Tax Assessment Total Assessment is a certain percentage of the fair market value that is determined by local assessors to be the total taxable value of land and additions on the property. | Land | Improvement |
|---|---|---|---|---|
| 2025 | $1,562 | $89,544 | $33,600 | $55,944 |
| 2024 | $1,517 | $89,544 | $33,600 | $55,944 |
| 2023 | $1,517 | $82,601 | $28,700 | $53,901 |
| 2022 | $1,473 | $73,694 | $24,150 | $49,544 |
| 2021 | $1,430 | $68,833 | $21,350 | $47,483 |
| 2020 | $1,386 | $56,068 | $21,000 | $35,068 |
| 2019 | $1,345 | $66,997 | $19,950 | $47,047 |
| 2018 | $1,306 | $60,712 | $15,400 | $45,312 |
| 2017 | $1,984 | $60,530 | $14,350 | $46,180 |
| 2016 | $1,238 | $54,927 | $10,500 | $44,427 |
| 2015 | $1,235 | $47,114 | $9,100 | $38,014 |
| 2014 | $1,199 | $40,788 | $5,950 | $34,838 |
Source: Public Records
Map
Nearby Homes
- 4109 Glenfield Cir
- 4061 Browndeer Cir
- 7223 Hollywood Park Ave
- 4053 Hazelridge Dr
- 4224 Perfect Drift St
- 7251 Daily Double Ave
- 4025 Cunning Fellow Ct
- 4025 Sea Hero St
- 4021 Sea Hero St Unit 1
- 4252 Olympic Point Dr
- 3351 Dancing Waters St
- 3344 Dancing Waters St
- 3350 Dancing Waters St
- 4205 Thunder Twice St
- 4052 Cape Sand Dr
- 4356 Perfect Drift St
- 7349 Dolphine Crest Ave
- 7408 Summer Crest Ln
- 6900 Quail Hollow Dr
- 7418 Lawrence Powers Ct
- 4128 Browndeer Cir
- 4136 Browndeer Cir
- 4140 Browndeer Cir
- 4124 Browndeer Cir
- 4137 Glenfield Cir
- 4129 Glenfield Cir
- 4144 Browndeer Cir
- 4141 Glenfield Cir
- 4120 Browndeer Cir
- 4133 Browndeer Cir
- 4129 Browndeer Cir
- 4145 Glenfield Cir
- 4121 Glenfield Cir
- 4116 Browndeer Cir
- 4137 Browndeer Cir
- 4125 Browndeer Cir
- 4141 Browndeer Cir
- 4145 Browndeer Cir
- 4121 Browndeer Cir