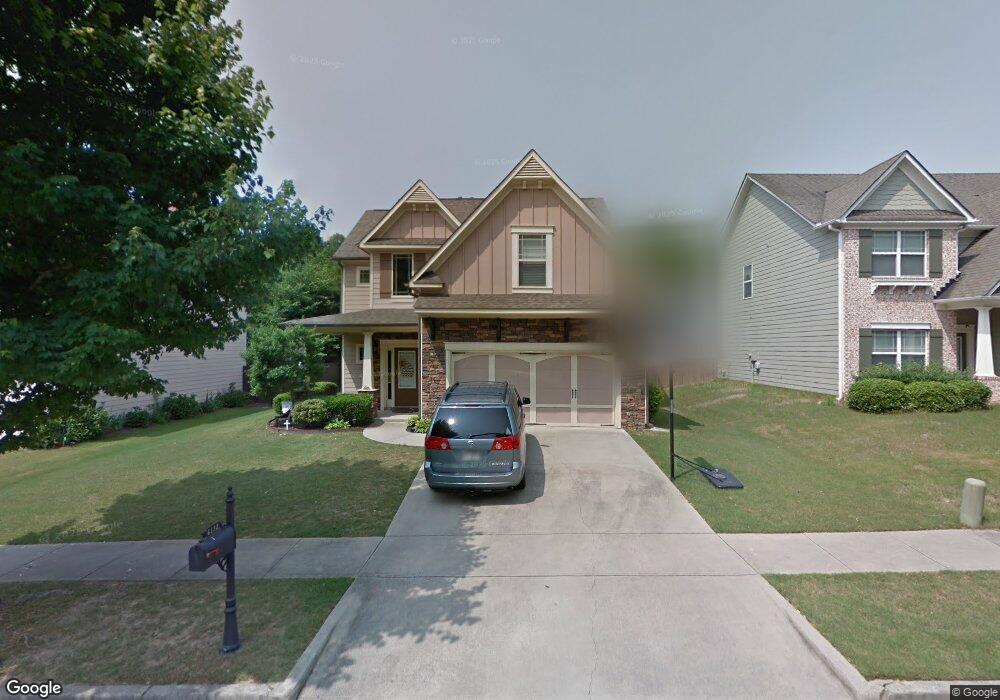
4132 Creekrun Cir Buford, GA 30519
Estimated Value: $397,617 - $438,000
4
Beds
3
Baths
2,204
Sq Ft
$192/Sq Ft
Est. Value
About This Home
This home is located at 4132 Creekrun Cir, Buford, GA 30519 and is currently estimated at $422,904, approximately $191 per square foot. 4132 Creekrun Cir is a home located in Gwinnett County with nearby schools including Harmony Elementary School and Glenn C. Jones Middle School.
Ownership History
Date
Name
Owned For
Owner Type
Purchase Details
Closed on
May 27, 2010
Sold by
Federal Natl Mtg Assn Fnma
Bought by
Sindon Robert D and Sindon Kelley
Current Estimated Value
Home Financials for this Owner
Home Financials are based on the most recent Mortgage that was taken out on this home.
Original Mortgage
$147,904
Outstanding Balance
$97,873
Interest Rate
4.87%
Mortgage Type
FHA
Estimated Equity
$325,032
Purchase Details
Closed on
Feb 2, 2010
Sold by
Bac Home Loans Servicing Lp
Bought by
Federal Natl Mtg Assn Fnma
Purchase Details
Closed on
Aug 29, 2006
Sold by
Marchman Rebecca
Bought by
Marchman Rebecca and Abdur-Rahman Nuraddeen
Home Financials for this Owner
Home Financials are based on the most recent Mortgage that was taken out on this home.
Original Mortgage
$171,120
Interest Rate
6.67%
Mortgage Type
New Conventional
Create a Home Valuation Report for This Property
The Home Valuation Report is an in-depth analysis detailing your home's value as well as a comparison with similar homes in the area
Home Values in the Area
Average Home Value in this Area
Purchase History
| Date | Buyer | Sale Price | Title Company |
|---|---|---|---|
| Sindon Robert D | -- | -- | |
| Federal Natl Mtg Assn Fnma | -- | -- | |
| Bac Home Loans Servicing Lp | $211,123 | -- | |
| Marchman Rebecca | -- | -- | |
| Marchman Rebecca | $213,900 | -- |
Source: Public Records
Mortgage History
| Date | Status | Borrower | Loan Amount |
|---|---|---|---|
| Open | Sindon Robert D | $147,904 | |
| Previous Owner | Marchman Rebecca | $171,120 | |
| Previous Owner | Marchman Rebecca | $42,780 |
Source: Public Records
Tax History Compared to Growth
Tax History
| Year | Tax Paid | Tax Assessment Tax Assessment Total Assessment is a certain percentage of the fair market value that is determined by local assessors to be the total taxable value of land and additions on the property. | Land | Improvement |
|---|---|---|---|---|
| 2025 | $4,573 | $173,760 | $40,000 | $133,760 |
| 2024 | $3,789 | $128,760 | $26,000 | $102,760 |
| 2023 | $3,789 | $128,760 | $26,000 | $102,760 |
| 2022 | $3,751 | $128,760 | $26,000 | $102,760 |
| 2021 | $3,077 | $94,040 | $18,000 | $76,040 |
| 2020 | $3,098 | $94,040 | $18,000 | $76,040 |
| 2019 | $3,014 | $94,040 | $18,000 | $76,040 |
| 2018 | $2,940 | $90,560 | $18,000 | $72,560 |
| 2016 | $2,734 | $80,040 | $15,600 | $64,440 |
| 2015 | $2,459 | $66,320 | $13,600 | $52,720 |
| 2014 | $2,471 | $66,320 | $13,600 | $52,720 |
Source: Public Records
Map
Nearby Homes
- 2997 Spring Lake Dr
- 2997 Springlake Dr
- 3026 Sea Aster Way
- 4375 Easter Lily Ave
- 3016 Sea Aster Way
- 3170 Tallulah Dr
- 3236 Copper Creek Ln NE
- 3340 Ivey Ridge Rd NE
- 3345 Stoneleigh Run Dr
- 3320 Goldmist Dr
- 4298 Friar Tuck Ln
- 2910 Blake Towers Ln
- 2930 Blake Towers Ln
- 3939 Bessemer Dr Unit 2
- 3606 Andover Way
- 3075 Andover Trail
- 3421 Andover Way
- 3210 Golden Spring Dr Unit 1
- 2740 Blake Towers Ln
- 4122 Creekrun Cir
- 4142 Creekrun Cir
- 4242 Creekrun Cir Unit 4242
- 4242 Creekrun Cir
- 4112 Creekrun Cir
- 4232 Creekrun Cir
- 4252 Creekrun Cir Unit 29
- 4252 Creekrun Cir
- 4123 Creekrun Cir
- 4162 Creekrun Cir
- 4112 4112 Creek Run Cir
- 4133 Creekrun Cir
- 4113 Creekrun Cir
- 4262 Creekrun Cir
- 4143 Creekrun Cir
- 4202 Creekrun Cir Unit 4202
- 4202 Creekrun Cir
- 4102 Creekrun Cir
- 4103 Creekrun Cir
- 4153 Creekrun Cir