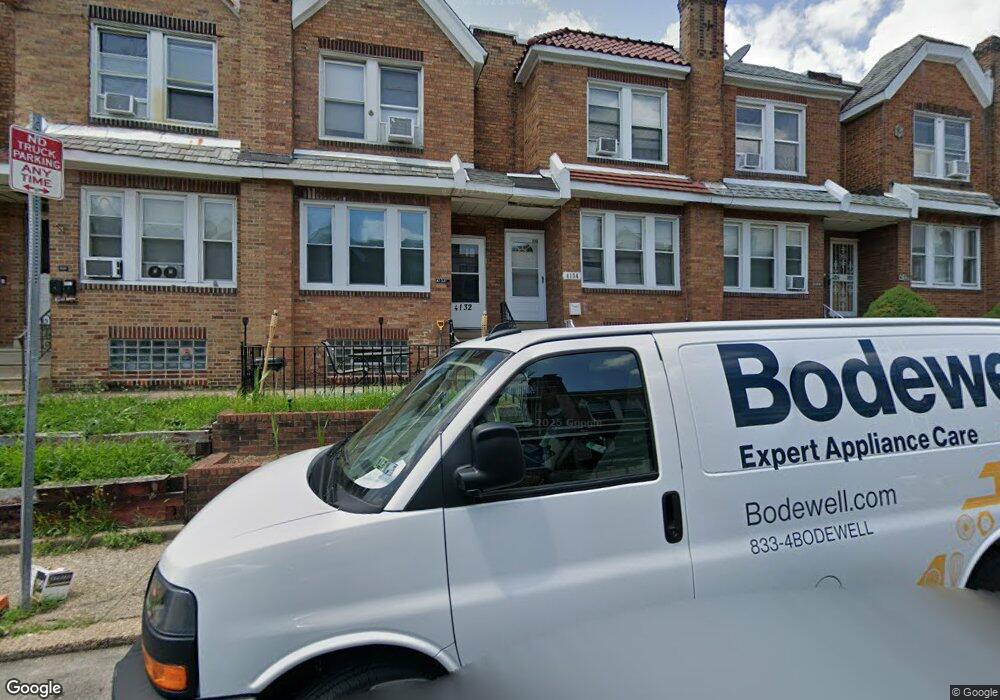
4132 Dungan St Philadelphia, PA 19124
Juniata Park NeighborhoodEstimated Value: $199,926 - $254,000
3
Beds
1
Bath
1,350
Sq Ft
$170/Sq Ft
Est. Value
About This Home
This home is located at 4132 Dungan St, Philadelphia, PA 19124 and is currently estimated at $229,482, approximately $169 per square foot. 4132 Dungan St is a home located in Philadelphia County with nearby schools including Francis Hopkinson School, Frankford High School, and Community Academy of Philadelphia CS.
Ownership History
Date
Name
Owned For
Owner Type
Purchase Details
Closed on
Sep 12, 2018
Sold by
Principal Equities Inc
Bought by
The Blue Fox Partnership Llc
Current Estimated Value
Home Financials for this Owner
Home Financials are based on the most recent Mortgage that was taken out on this home.
Original Mortgage
$100,000
Outstanding Balance
$86,846
Interest Rate
4.5%
Mortgage Type
Commercial
Estimated Equity
$142,636
Purchase Details
Closed on
Oct 19, 2000
Sold by
Hud
Bought by
Principal Equities Inc
Home Financials for this Owner
Home Financials are based on the most recent Mortgage that was taken out on this home.
Original Mortgage
$39,000
Interest Rate
7.52%
Purchase Details
Closed on
Jun 14, 1999
Sold by
Smith Edward W and Provident Bank Of Maryland
Bought by
Hud
Create a Home Valuation Report for This Property
The Home Valuation Report is an in-depth analysis detailing your home's value as well as a comparison with similar homes in the area
Home Values in the Area
Average Home Value in this Area
Purchase History
| Date | Buyer | Sale Price | Title Company |
|---|---|---|---|
| The Blue Fox Partnership Llc | -- | Assurance Abstract Corp | |
| Principal Equities Inc | $32,000 | Security Search & Abstract C | |
| Hud | $7,200 | -- |
Source: Public Records
Mortgage History
| Date | Status | Borrower | Loan Amount |
|---|---|---|---|
| Open | The Blue Fox Partnership Llc | $100,000 | |
| Previous Owner | Principal Equities Inc | $39,000 |
Source: Public Records
Tax History Compared to Growth
Tax History
| Year | Tax Paid | Tax Assessment Tax Assessment Total Assessment is a certain percentage of the fair market value that is determined by local assessors to be the total taxable value of land and additions on the property. | Land | Improvement |
|---|---|---|---|---|
| 2026 | $2,009 | $168,800 | $33,760 | $135,040 |
| 2025 | $2,009 | $168,800 | $33,760 | $135,040 |
| 2024 | $2,009 | $168,800 | $33,760 | $135,040 |
| 2023 | $2,009 | $143,500 | $28,700 | $114,800 |
| 2022 | $1,432 | $143,500 | $28,700 | $114,800 |
| 2021 | $1,432 | $0 | $0 | $0 |
| 2020 | $1,432 | $0 | $0 | $0 |
| 2019 | $1,330 | $0 | $0 | $0 |
| 2018 | $1,187 | $0 | $0 | $0 |
| 2017 | $1,187 | $0 | $0 | $0 |
| 2016 | $1,187 | $0 | $0 | $0 |
| 2015 | $1,136 | $0 | $0 | $0 |
| 2014 | -- | $84,800 | $13,632 | $71,168 |
| 2012 | -- | $11,392 | $1,364 | $10,028 |
Source: Public Records
Map
Nearby Homes
- 4132 Claridge St
- 4118 K St
- 4150 Maywood St
- 4013 Dungan St
- 4149 Bennington St
- 4247 Glendale St
- 4252 M St
- 1400 E Bristol St
- 4042 Castor Ave
- 3934 Howland St
- 4034 Lawndale St
- 4318 Glendale St
- 4218 Castor Ave
- 3925 L St
- 3928 Howland St
- 4238 Castor Ave
- 4320 Claridge St
- 4304 Bennington St
- 4221 Neilson St
- 3882 Glendale St