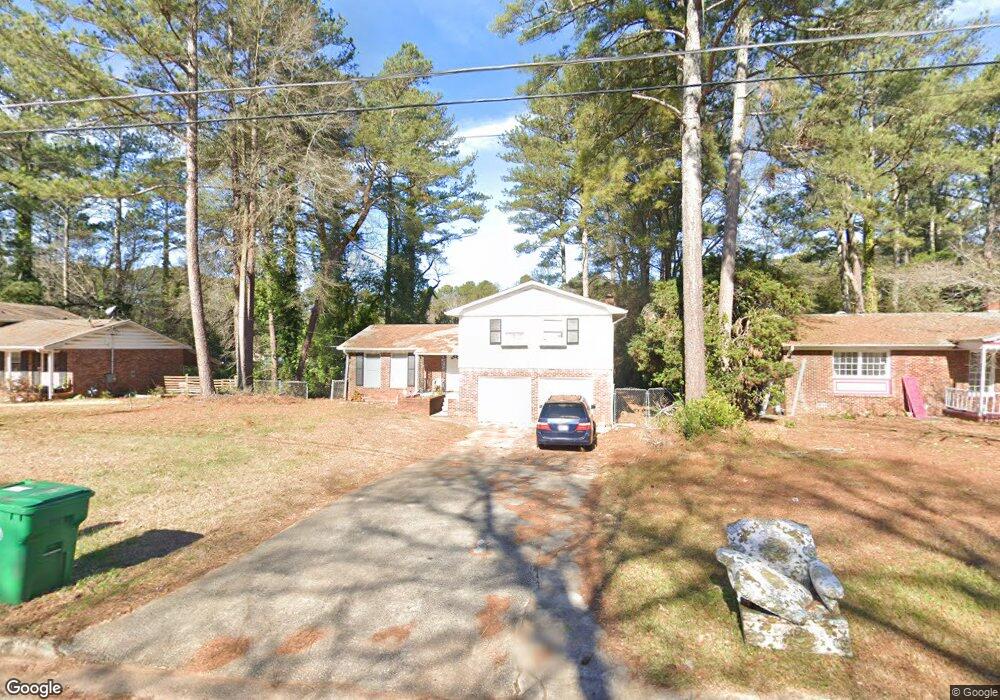
4132 Rue Dartagnan Stone Mountain, GA 30083
Estimated Value: $295,000 - $346,000
5
Beds
3
Baths
2,700
Sq Ft
$120/Sq Ft
Est. Value
About This Home
This home is located at 4132 Rue Dartagnan, Stone Mountain, GA 30083 and is currently estimated at $323,793, approximately $119 per square foot. 4132 Rue Dartagnan is a home located in DeKalb County with nearby schools including Allgood Elementary School, Freedom Middle School, and Clarkston High School.
Ownership History
Date
Name
Owned For
Owner Type
Purchase Details
Closed on
Dec 8, 2017
Sold by
Gelan Workeneh M
Bought by
Ahamed Mohamad Rafiq Bin Kalil
Current Estimated Value
Home Financials for this Owner
Home Financials are based on the most recent Mortgage that was taken out on this home.
Original Mortgage
$151,210
Outstanding Balance
$126,774
Interest Rate
3.87%
Mortgage Type
FHA
Estimated Equity
$197,019
Purchase Details
Closed on
Jan 30, 2002
Sold by
Lewis Desmond M and Lewis Seberrie
Bought by
Gelan Workeneh M
Home Financials for this Owner
Home Financials are based on the most recent Mortgage that was taken out on this home.
Original Mortgage
$117,600
Interest Rate
7.14%
Mortgage Type
New Conventional
Purchase Details
Closed on
Sep 1, 1999
Sold by
Mekonen Ghirmay
Bought by
Light-Lewis Sebeine
Home Financials for this Owner
Home Financials are based on the most recent Mortgage that was taken out on this home.
Original Mortgage
$130,950
Interest Rate
7.73%
Mortgage Type
New Conventional
Create a Home Valuation Report for This Property
The Home Valuation Report is an in-depth analysis detailing your home's value as well as a comparison with similar homes in the area
Home Values in the Area
Average Home Value in this Area
Purchase History
| Date | Buyer | Sale Price | Title Company |
|---|---|---|---|
| Ahamed Mohamad Rafiq Bin Kalil | $154,000 | -- | |
| Gelan Workeneh M | $147,000 | -- | |
| Light-Lewis Sebeine | $135,000 | -- | |
| Lewis Sebeine D | -- | -- |
Source: Public Records
Mortgage History
| Date | Status | Borrower | Loan Amount |
|---|---|---|---|
| Open | Ahamed Mohamad Rafiq Bin Kalil | $151,210 | |
| Previous Owner | Gelan Workeneh M | $117,600 | |
| Previous Owner | Lewis Sebeine D | $130,950 |
Source: Public Records
Tax History Compared to Growth
Tax History
| Year | Tax Paid | Tax Assessment Tax Assessment Total Assessment is a certain percentage of the fair market value that is determined by local assessors to be the total taxable value of land and additions on the property. | Land | Improvement |
|---|---|---|---|---|
| 2025 | $3,577 | $129,200 | $18,160 | $111,040 |
| 2024 | $3,705 | $131,240 | $18,160 | $113,080 |
| 2023 | $3,705 | $127,480 | $18,160 | $109,320 |
| 2022 | $2,909 | $99,360 | $15,000 | $84,360 |
| 2021 | $2,345 | $74,880 | $8,000 | $66,880 |
| 2020 | $2,051 | $61,960 | $8,000 | $53,960 |
| 2019 | $1,993 | $60,320 | $8,000 | $52,320 |
| 2018 | $2,098 | $58,760 | $10,240 | $48,520 |
| 2017 | $2,373 | $45,960 | $10,240 | $35,720 |
| 2016 | $1,383 | $41,600 | $10,240 | $31,360 |
| 2014 | $945 | $28,840 | $10,240 | $18,600 |
Source: Public Records
Map
Nearby Homes
- 4210 Rockbridge Rd
- 494 Rue Montaigne
- 4328 Rockbridge Rd
- 579 Kenridge Cir
- 570 Kenridge Cir
- 539 Rue Montaigne
- 450 S Susan Creek Dr
- 550 S Rays (9 74 Acres) Rd
- 550 S Rays (8 6 Acres) Rd
- 550 S Rays Rd
- 440 Sheppard Xing Ct
- 4238 Rue Saint Michel
- 4166 Rue Saint Michel
- 4250 Village Square Ln
- 4128 Indian Manor Dr
- 3943 Dunaire Dr
- 488 Barclay Ct
- 534 Woodcrest Manor Dr
- 4116 Warrior Trail Unit 2
- 4096 Warrior Trail
- 4126 Rue Dartagnan
- 4138 Rue Dartagnan
- 4144 Rue Dartagnan
- 4127 Rue Antoinette Unit 2
- 4118 Rue Dartagnan Unit 2
- 4119 Rue Antoinette
- 4135 Rue Antoinette
- 0 Rue Antoinette Unit 7454557
- 0 Rue Antoinette
- 0 Rue Dartagnan Unit 7479690
- 0 Rue Dartagnan
- 4129 Rue Dartagnan
- 4143 Rue Antoinette
- 4113 Rue Antoinette
- 4137 Rue Dartagnan
- 4152 Rue Dartagnan
- 4123 Rue Dartagnan
- 4079 Rue Antoinette
- 4145 Rue Dartagnan
- 4149 Rue Antoinette