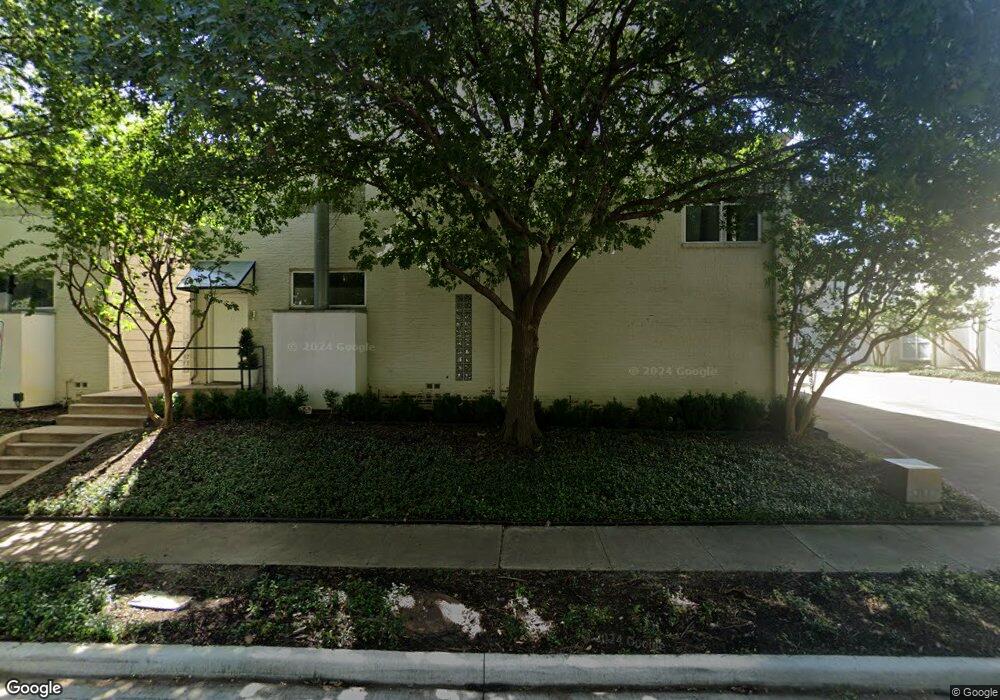
4134 Travis St Unit 20 Dallas, TX 75204
Uptown NeighborhoodEstimated Value: $345,000 - $442,000
1
Bed
2
Baths
1,033
Sq Ft
$368/Sq Ft
Est. Value
About This Home
This home is located at 4134 Travis St Unit 20, Dallas, TX 75204 and is currently estimated at $380,627, approximately $368 per square foot. 4134 Travis St Unit 20 is a home located in Dallas County with nearby schools including Ben Milam Elementary School, Alex W. Spence Talented/Gifted Academy, and North Dallas High School.
Ownership History
Date
Name
Owned For
Owner Type
Purchase Details
Closed on
Sep 28, 2007
Sold by
Phillips Dina
Bought by
Anichini Williams Jenny
Current Estimated Value
Home Financials for this Owner
Home Financials are based on the most recent Mortgage that was taken out on this home.
Original Mortgage
$186,000
Outstanding Balance
$118,840
Interest Rate
6.66%
Mortgage Type
Purchase Money Mortgage
Estimated Equity
$261,787
Purchase Details
Closed on
Aug 28, 2003
Sold by
Alabi Olumayowa and Alabi Leslie J Calihman
Bought by
Phillips Dina
Purchase Details
Closed on
Sep 16, 1997
Sold by
Parkwood Development Xii Ltd Partnership
Bought by
Alabi Olumayowa and Alabi Olukorede
Home Financials for this Owner
Home Financials are based on the most recent Mortgage that was taken out on this home.
Original Mortgage
$93,000
Interest Rate
7.34%
Create a Home Valuation Report for This Property
The Home Valuation Report is an in-depth analysis detailing your home's value as well as a comparison with similar homes in the area
Home Values in the Area
Average Home Value in this Area
Purchase History
| Date | Buyer | Sale Price | Title Company |
|---|---|---|---|
| Anichini Williams Jenny | -- | Rtt | |
| Phillips Dina | -- | Allegiance Title | |
| Alabi Olumayowa | -- | -- |
Source: Public Records
Mortgage History
| Date | Status | Borrower | Loan Amount |
|---|---|---|---|
| Open | Anichini Williams Jenny | $186,000 | |
| Previous Owner | Alabi Olumayowa | $93,000 |
Source: Public Records
Tax History Compared to Growth
Tax History
| Year | Tax Paid | Tax Assessment Tax Assessment Total Assessment is a certain percentage of the fair market value that is determined by local assessors to be the total taxable value of land and additions on the property. | Land | Improvement |
|---|---|---|---|---|
| 2025 | $4,972 | $340,890 | $136,010 | $204,880 |
| 2024 | $4,972 | $340,890 | $136,010 | $204,880 |
| 2023 | $4,972 | $309,900 | $136,010 | $173,890 |
| 2022 | $7,749 | $309,900 | $136,010 | $173,890 |
| 2021 | $6,268 | $237,590 | $136,010 | $101,580 |
| 2020 | $6,446 | $237,590 | $136,010 | $101,580 |
| 2019 | $6,760 | $237,590 | $97,150 | $140,440 |
| 2018 | $5,390 | $237,590 | $97,150 | $140,440 |
| 2017 | $6,040 | $222,100 | $97,150 | $124,950 |
| 2016 | $5,478 | $201,440 | $97,150 | $104,290 |
| 2015 | $4,817 | $175,610 | $58,290 | $117,320 |
| 2014 | $4,817 | $175,610 | $58,290 | $117,320 |
Source: Public Records
Map
Nearby Homes
- 4134 Travis St Unit 11
- 4134 Travis St Unit 1
- 4122 Travis St Unit 9
- 4122 Travis St Unit 19B
- 4125 Cole Ave Unit 7
- 4124 Cole Ave Unit 209D
- 4116 Cole Ave Unit 307
- 4102 Buena Vista St Unit 3
- 4127 Buena Vista St
- 4219 Travis St
- 4060 Travis St Unit 12
- 4223 Buena Vista St Unit 1
- 4231 Travis St Unit 29
- 4231 Travis St Unit 22
- 4231 Travis St Unit 17
- 4242 Buena Vista St Unit 22
- 4121 Mckinney Ave Unit 30
- 4121 Mckinney Ave Unit 21
- 4229 Cole Ave Unit 115C
- 4205 Buena Vista St Unit 301
- 4134 Travis St Unit 15
- 4134 Travis St Unit 2
- 4134 Travis St Unit 6
- 4134 Travis St Unit 14
- 4134 Travis St Unit 19
- 4134 Travis St Unit 7
- 4134 Travis St Unit 21
- 4134 Travis St Unit 9
- 4134 Travis St Unit 16
- 4134 Travis St Unit 4
- 4134 Travis St Unit 17
- 4134 Travis St Unit 3
- 4134 Travis St Unit 10
- 4134 Travis St Unit 22
- 4134 Travis St Unit 12
- 4134 Travis St Unit 5
- 4134 Travis St Unit 8
- 4134 Travis St
- 4138 Travis St
- 4140 Travis St