Estimated Value: $320,000 - $361,000
3
Beds
3
Baths
1,987
Sq Ft
$168/Sq Ft
Est. Value
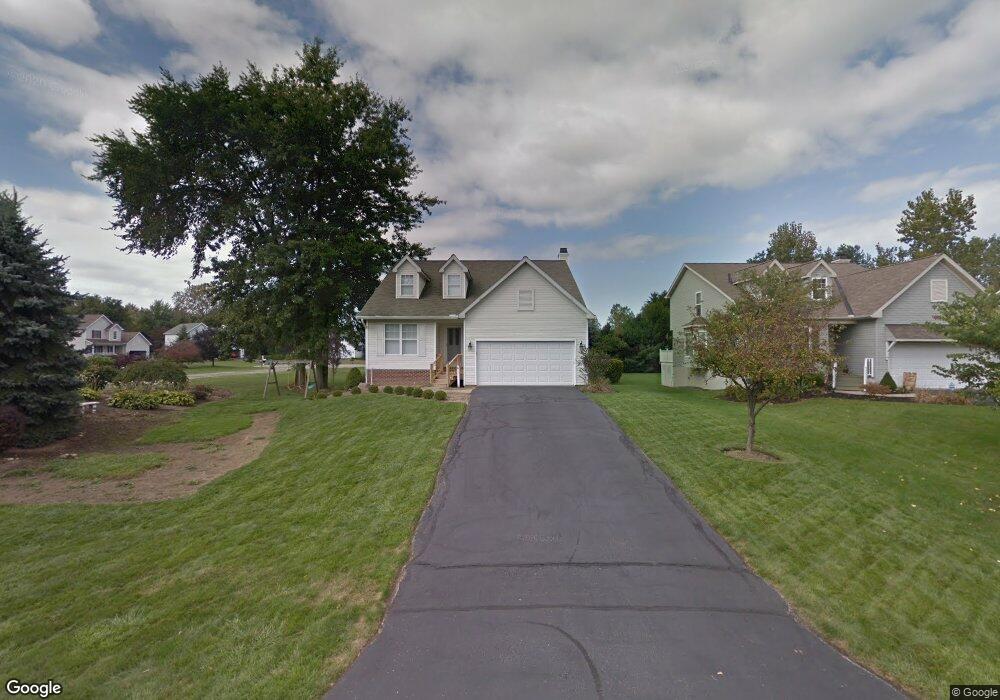
About This Home
This home is located at 4134 White Oak Ct, Perry, OH 44081 and is currently estimated at $334,629, approximately $168 per square foot. 4134 White Oak Ct is a home located in Lake County with nearby schools including Perry Middle School, Perry High School, and Summit Academy Community School - Painesville.
Ownership History
Date
Name
Owned For
Owner Type
Purchase Details
Closed on
Jun 14, 2005
Sold by
Baruffa Susan D
Bought by
Pfeifer Scott B and Pfeifer Stacey L
Current Estimated Value
Home Financials for this Owner
Home Financials are based on the most recent Mortgage that was taken out on this home.
Original Mortgage
$168,000
Outstanding Balance
$88,045
Interest Rate
5.82%
Mortgage Type
Fannie Mae Freddie Mac
Estimated Equity
$246,584
Purchase Details
Closed on
May 27, 2004
Sold by
Baruffa Christopher J
Bought by
Baruffa Susan D
Purchase Details
Closed on
Dec 7, 1999
Sold by
Birchfield Deve Inc
Bought by
Baruffa Christopher J and Baruffa Susan D
Home Financials for this Owner
Home Financials are based on the most recent Mortgage that was taken out on this home.
Original Mortgage
$161,400
Interest Rate
7.87%
Purchase Details
Closed on
Jan 1, 1990
Bought by
Birchfield Deve Inc
Create a Home Valuation Report for This Property
The Home Valuation Report is an in-depth analysis detailing your home's value as well as a comparison with similar homes in the area
Home Values in the Area
Average Home Value in this Area
Purchase History
| Date | Buyer | Sale Price | Title Company |
|---|---|---|---|
| Pfeifer Scott B | $210,000 | -- | |
| Baruffa Susan D | -- | -- | |
| Baruffa Christopher J | $189,900 | Commonwealth Land Title Agen | |
| Birchfield Deve Inc | -- | -- |
Source: Public Records
Mortgage History
| Date | Status | Borrower | Loan Amount |
|---|---|---|---|
| Open | Pfeifer Scott B | $168,000 | |
| Closed | Baruffa Christopher J | $161,400 | |
| Closed | Pfeifer Scott B | $21,000 |
Source: Public Records
Tax History Compared to Growth
Tax History
| Year | Tax Paid | Tax Assessment Tax Assessment Total Assessment is a certain percentage of the fair market value that is determined by local assessors to be the total taxable value of land and additions on the property. | Land | Improvement |
|---|---|---|---|---|
| 2024 | -- | $98,510 | $19,500 | $79,010 |
| 2023 | $4,370 | $94,190 | $16,370 | $77,820 |
| 2022 | $4,382 | $94,190 | $16,370 | $77,820 |
| 2021 | $4,109 | $94,190 | $16,370 | $77,820 |
| 2020 | $3,801 | $78,490 | $13,650 | $64,840 |
| 2019 | $3,804 | $78,490 | $13,650 | $64,840 |
| 2018 | $3,574 | $63,720 | $12,280 | $51,440 |
| 2017 | $3,072 | $63,720 | $12,280 | $51,440 |
| 2016 | $3,012 | $62,910 | $12,280 | $50,630 |
| 2015 | $3,011 | $62,910 | $12,280 | $50,630 |
| 2014 | $2,955 | $62,910 | $12,280 | $50,630 |
| 2013 | $2,953 | $62,910 | $12,280 | $50,630 |
Source: Public Records
Map
Nearby Homes
- 4300 Florida St
- 3158 Narrows Rd
- 3147 Maine Ave
- 4505 Lane Rd
- 108 Birch Dr
- 269 Hale Rd
- 808 N Creek Dr
- 720 N Creek Dr
- 712 N Creek Dr
- 634 N Creek Dr
- 1978 Marsh Ln Unit 1978
- 1787 Muirfield Ln
- 525 Morgan Dr
- 1788 Kirtstone Terrace
- 1865 Marsh Ln Unit 1865
- 3781 Main St
- 751 Bacon Rd
- 500 Park Rd
- 1806 Muirfield Ln
- 1719 Duffton Ln
- 4124 White Oak Ct
- 2875 Red Oak Dr
- 2886 Red Oak Dr
- 2896 Red Oak Dr
- 4133 White Oak Ct
- 2906 Red Oak Dr
- 4123 White Oak Ct
- 2865 Red Oak Dr
- 4104 White Oak Ct
- 2916 Red Oak Dr
- 4113 White Oak Ct
- 2855 Red Oak Dr
- 2866 Red Oak Dr
- 4103 White Oak Ct
- 2856 Red Oak Dr
- 2919 Red Oak Dr
- 2920 Red Oak Dr
- 4148 White Cedar Place
- 2870 Narrows Rd
- 2860 Narrows Rd