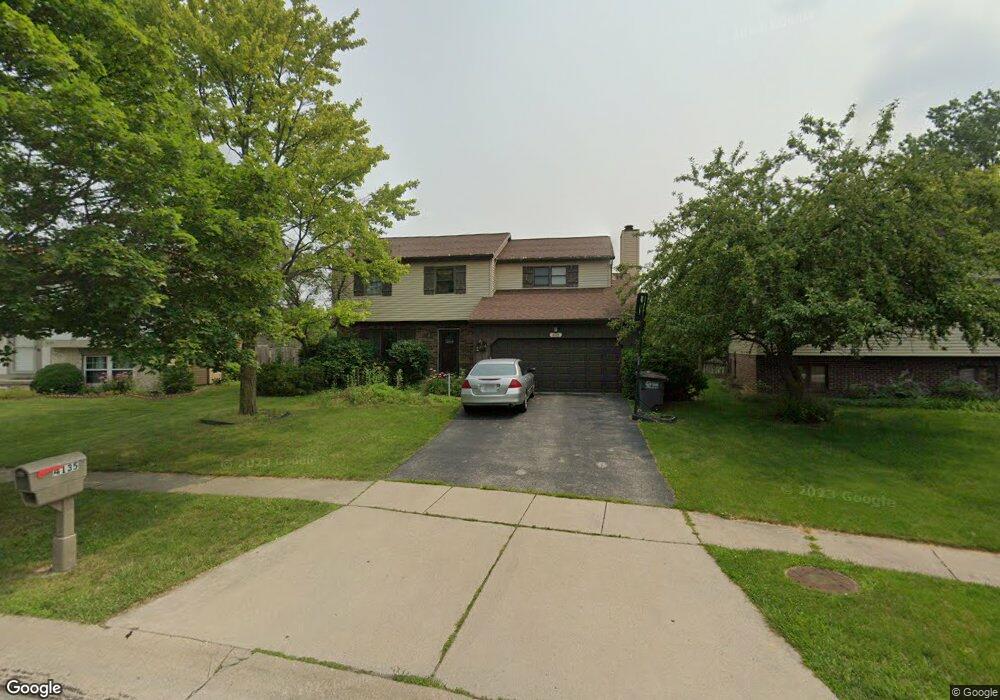
4135 Brogan Dr Toledo, OH 43614
Southwyck NeighborhoodEstimated Value: $271,000 - $282,494
4
Beds
3
Baths
1,990
Sq Ft
$139/Sq Ft
Est. Value
About This Home
This home is located at 4135 Brogan Dr, Toledo, OH 43614 and is currently estimated at $275,874, approximately $138 per square foot. 4135 Brogan Dr is a home located in Lucas County with nearby schools including Maumee Intermediate School, Fort Miami Elementary School, and Maumee Middle School.
Ownership History
Date
Name
Owned For
Owner Type
Purchase Details
Closed on
Mar 12, 2008
Sold by
Fannie Mae
Bought by
Farmer Kristin A and Farmer Edward T
Current Estimated Value
Home Financials for this Owner
Home Financials are based on the most recent Mortgage that was taken out on this home.
Original Mortgage
$139,000
Outstanding Balance
$86,595
Interest Rate
5.74%
Mortgage Type
Purchase Money Mortgage
Estimated Equity
$189,279
Purchase Details
Closed on
Jul 27, 2007
Sold by
Duty James and Duty Amy
Bought by
Federal National Mortgage Association
Purchase Details
Closed on
Oct 15, 2001
Sold by
Junga Joel F and Junga Kristen E
Bought by
Duty James W and Duty Amy M
Home Financials for this Owner
Home Financials are based on the most recent Mortgage that was taken out on this home.
Original Mortgage
$132,000
Interest Rate
6.92%
Purchase Details
Closed on
Jun 1, 1993
Sold by
Basso William B and Basso Victoria
Create a Home Valuation Report for This Property
The Home Valuation Report is an in-depth analysis detailing your home's value as well as a comparison with similar homes in the area
Home Values in the Area
Average Home Value in this Area
Purchase History
| Date | Buyer | Sale Price | Title Company |
|---|---|---|---|
| Farmer Kristin A | $139,000 | Accutitle Agency Inc | |
| Federal National Mortgage Association | $130,667 | None Available | |
| Duty James W | $165,000 | -- | |
| -- | $122,500 | -- |
Source: Public Records
Mortgage History
| Date | Status | Borrower | Loan Amount |
|---|---|---|---|
| Open | Farmer Kristin A | $139,000 | |
| Previous Owner | Duty James W | $132,000 |
Source: Public Records
Tax History Compared to Growth
Tax History
| Year | Tax Paid | Tax Assessment Tax Assessment Total Assessment is a certain percentage of the fair market value that is determined by local assessors to be the total taxable value of land and additions on the property. | Land | Improvement |
|---|---|---|---|---|
| 2024 | $2,591 | $83,930 | $11,550 | $72,380 |
| 2023 | $4,392 | $60,865 | $9,100 | $51,765 |
| 2022 | $4,227 | $60,865 | $9,100 | $51,765 |
| 2021 | $4,448 | $60,865 | $9,100 | $51,765 |
| 2020 | $4,157 | $49,945 | $7,490 | $42,455 |
| 2019 | $4,049 | $49,945 | $7,490 | $42,455 |
| 2018 | $4,037 | $49,945 | $7,490 | $42,455 |
| 2017 | $3,841 | $47,005 | $7,700 | $39,305 |
| 2016 | $3,820 | $134,300 | $22,000 | $112,300 |
| 2015 | $3,806 | $134,300 | $22,000 | $112,300 |
| 2014 | $3,473 | $47,010 | $7,700 | $39,310 |
| 2013 | $3,473 | $47,010 | $7,700 | $39,310 |
Source: Public Records
Map
Nearby Homes
- 4237 Brogan Dr
- 4035 Greencrest Ln
- 5125 Stengel Ave
- 5022 Stengel Ave
- 1466 Wilderness Dr
- 3044 Villa Dr
- 1220 Birch Ave
- 4522 Heathercove Place
- 1181 Craig Rd
- 1553 Heather Meadow Dr
- 1969 Oaklawn Dr
- 632 Brahier Ln
- 1206 Fort St
- 1919 Colony Dr
- 2017 Green Valley Dr
- 1057 Keeler St
- 3638 Treelawn Dr
- 649 Midfield Dr
- 4784 Santa Maria Dr
- 1734 Archwood Ln
- 4139 Brogan Dr
- 4129 Brogan Dr
- 2586 Green Valley Dr
- 2604 Green Valley Dr
- 4143 Brogan Dr
- 4123 Brogan Dr
- 2580 Green Valley Dr
- 2612 Green Valley Dr
- 2574 Green Valley Dr
- 4154 Valleycrest Ct
- 4138 Brogan Dr
- 4149 Brogan Dr
- 2622 Green Valley Dr
- 4117 Brogan Dr
- 4150 Valleycrest Ct
- 4154 Valley Crest
- 4154 Brogan Dr
- 4160 Valleycrest Ct
- 4155 Brogan Dr
- 2628 Green Valley Dr