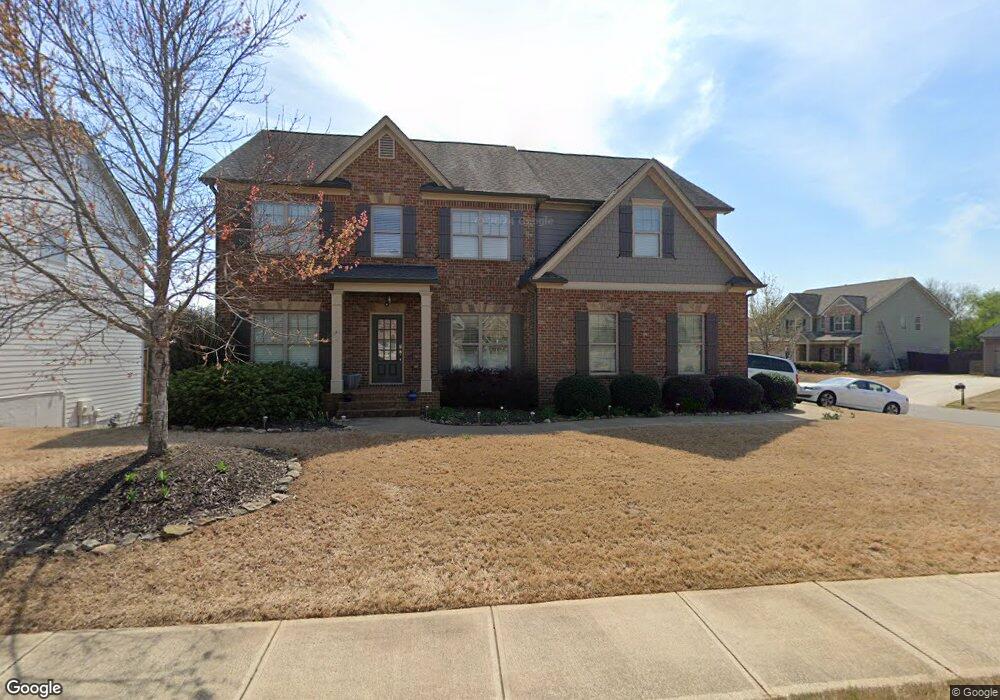
4135 Hunters Walk Way Cumming, GA 30028
Estimated Value: $599,000 - $630,340
5
Beds
4
Baths
2,818
Sq Ft
$218/Sq Ft
Est. Value
About This Home
This home is located at 4135 Hunters Walk Way, Cumming, GA 30028 and is currently estimated at $614,085, approximately $217 per square foot. 4135 Hunters Walk Way is a home located in Forsyth County with nearby schools including Poole's Mill Elementary School, Liberty Middle School, and North Forsyth High School.
Ownership History
Date
Name
Owned For
Owner Type
Purchase Details
Closed on
Mar 30, 2021
Sold by
Hand Gregory Horace
Bought by
Karabekmez Furkan
Current Estimated Value
Home Financials for this Owner
Home Financials are based on the most recent Mortgage that was taken out on this home.
Original Mortgage
$405,000
Outstanding Balance
$364,059
Interest Rate
2.73%
Mortgage Type
New Conventional
Estimated Equity
$250,026
Purchase Details
Closed on
Apr 30, 2015
Sold by
Sr Homes Llc
Bought by
Hand Gregory Horacfe
Home Financials for this Owner
Home Financials are based on the most recent Mortgage that was taken out on this home.
Original Mortgage
$316,090
Interest Rate
3.8%
Mortgage Type
VA
Purchase Details
Closed on
Oct 18, 2013
Sold by
Autumn Proerties Llc
Bought by
Rilman Road Properties Llc
Create a Home Valuation Report for This Property
The Home Valuation Report is an in-depth analysis detailing your home's value as well as a comparison with similar homes in the area
Home Values in the Area
Average Home Value in this Area
Purchase History
| Date | Buyer | Sale Price | Title Company |
|---|---|---|---|
| Karabekmez Furkan | $458,000 | -- | |
| Hand Gregory Horacfe | $332,725 | -- | |
| Rilman Road Properties Llc | $70,000 | -- |
Source: Public Records
Mortgage History
| Date | Status | Borrower | Loan Amount |
|---|---|---|---|
| Open | Karabekmez Furkan | $405,000 | |
| Previous Owner | Hand Gregory Horacfe | $316,090 |
Source: Public Records
Tax History Compared to Growth
Tax History
| Year | Tax Paid | Tax Assessment Tax Assessment Total Assessment is a certain percentage of the fair market value that is determined by local assessors to be the total taxable value of land and additions on the property. | Land | Improvement |
|---|---|---|---|---|
| 2025 | $4,944 | $240,580 | $54,000 | $186,580 |
| 2024 | $4,944 | $231,304 | $50,000 | $181,304 |
| 2023 | $4,478 | $224,620 | $40,000 | $184,620 |
| 2022 | $4,544 | $143,668 | $26,000 | $117,668 |
| 2021 | $3,664 | $143,668 | $26,000 | $117,668 |
| 2020 | $3,534 | $137,360 | $24,000 | $113,360 |
| 2019 | $3,409 | $131,056 | $22,000 | $109,056 |
| 2018 | $3,502 | $135,028 | $22,000 | $113,028 |
| 2017 | $3,569 | $137,572 | $22,000 | $115,572 |
| 2016 | $3,248 | $122,372 | $16,000 | $106,372 |
| 2015 | $3,147 | $113,172 | $16,000 | $97,172 |
| 2014 | $371 | $14,000 | $0 | $0 |
Source: Public Records
Map
Nearby Homes
- 4275 Hunters Walk Way
- 4305 Hunters Walk Way
- 4215 Pheasant Run Trace
- 3880 Deer Run Dr
- 3945 Silverthorn Trace
- 3930 Pheasant Run Trace
- 4035 Haven Way
- 4040 Haven Way
- 4030 Haven Way
- 3705 Williams Point Dr
- 4020 Haven Way
- 3985 Haven Way
- 3975 Haven Way
- 3965 Haven Way
- 3505 Watson Rd
- BELLVIEW Plan at Haven Abbey
- WESTERLY Plan at Haven Abbey
- LYNNBROOK Plan at Haven Abbey
- 3905 Hurt Bridge Rd
- GRAYSON Plan at Haven Abbey
- 4210 Standing Rock Way Unit 47
- 4210 Standing Rock Way
- 4235 Hunters Walk Way
- 4235 Hunters Walk Way Unit 48
- 4220 Standing Rock Way
- 4220 Standing Rock Way Unit 46
- 4220 Standing Rock Way Unit ROCK
- 7080 Deer Run Dr
- 4210 Hunters Walk Way Unit 47
- 4210 Hunters Walk Way
- 4090 Deer Run
- 4220 Hunters Walk Way Unit 91
- 4220 Hunters Walk Way
- 4205 Standing Rock Way Unit 37
- 4205 Standing Rock Way
- 4230 Standing Rock Way Unit 45
- 4230 Standing Rock Way
- 4230 Hunters Walk Way Unit 90
- 4230 Hunters Walk Way
- 4090 Deer Run Dr