Estimated Value: $124,000 - $142,000
2
Beds
1
Bath
876
Sq Ft
$151/Sq Ft
Est. Value
About This Home
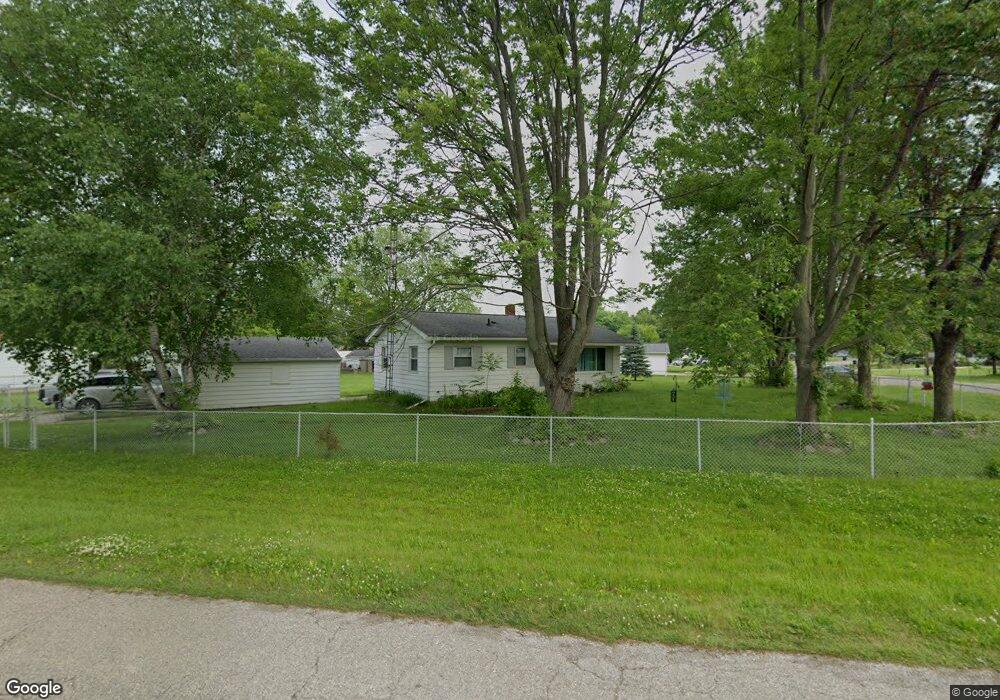
This home is located at 4135 Independence Dr, Flint, MI 48506 and is currently estimated at $132,490, approximately $151 per square foot. 4135 Independence Dr is a home located in Genesee County with nearby schools including Weston Elementary School, Leota Fiedler Elementary School, and Kate Dowdall Elementary School.
Ownership History
Date
Name
Owned For
Owner Type
Purchase Details
Closed on
Jun 13, 2022
Sold by
Mcqueen Steve and Mcqueen Michelle
Bought by
Mcqueen Steve and Mcqueen Steve
Current Estimated Value
Purchase Details
Closed on
Sep 13, 2011
Sold by
The Bank Of New York Mellon
Bought by
Mcqueen Steve
Purchase Details
Closed on
May 11, 2011
Sold by
Oliver Joshua and Oliver Andrea R
Bought by
The Bank Of New York Mellon and The Bank Of New York
Purchase Details
Closed on
Dec 17, 2003
Sold by
Hud
Bought by
Oliver Joshua J and Oliver Daniel Andrea
Purchase Details
Closed on
Jul 22, 2003
Sold by
Washington Mutual Bank Fa
Bought by
Hud
Purchase Details
Closed on
Jan 22, 2003
Sold by
Carpenter Terry L
Bought by
Washington Mutual Bank and Washington Mutual Home Loans Inc
Purchase Details
Closed on
Feb 5, 1999
Sold by
Kettler Ronald K and Kettler Anna M
Bought by
Carpenter Terry L
Create a Home Valuation Report for This Property
The Home Valuation Report is an in-depth analysis detailing your home's value as well as a comparison with similar homes in the area
Home Values in the Area
Average Home Value in this Area
Purchase History
| Date | Buyer | Sale Price | Title Company |
|---|---|---|---|
| Mcqueen Steve | -- | Mcqueen Michelle | |
| Mcqueen Steve | $22,000 | None Available | |
| The Bank Of New York Mellon | $30,000 | None Available | |
| Oliver Joshua J | $78,051 | Sargents Title Company | |
| Hud | -- | -- | |
| Washington Mutual Bank | $75,069 | -- | |
| Carpenter Terry L | $72,300 | Guaranty Title Company |
Source: Public Records
Tax History
| Year | Tax Paid | Tax Assessment Tax Assessment Total Assessment is a certain percentage of the fair market value that is determined by local assessors to be the total taxable value of land and additions on the property. | Land | Improvement |
|---|---|---|---|---|
| 2025 | $1,810 | $55,900 | $0 | $0 |
| 2024 | $326 | $51,500 | $0 | $0 |
| 2023 | $311 | $46,200 | $0 | $0 |
| 2022 | $1,514 | $43,400 | $0 | $0 |
| 2021 | $1,505 | $39,400 | $0 | $0 |
| 2020 | $285 | $36,400 | $0 | $0 |
| 2019 | $280 | $32,800 | $0 | $0 |
| 2018 | $1,438 | $29,500 | $0 | $0 |
| 2017 | $1,399 | $28,500 | $0 | $0 |
| 2016 | $1,392 | $27,500 | $0 | $0 |
| 2015 | $1,185 | $26,100 | $0 | $0 |
| 2014 | $258 | $23,300 | $0 | $0 |
| 2012 | -- | $23,000 | $23,000 | $0 |
Source: Public Records
Map
Nearby Homes
- 4062 N Belsay Rd
- 6161 Finch Ln
- 6054 E Pierson Rd
- 3365 Eastdale Dr
- 6363 Bluejay Dr
- 6443 Richfield Rd
- 3485 N Vassar Rd
- 3296 Mills Acres St
- 3267 Mills Acres St
- 3179 Gehring Dr
- 3148 Gehring Dr
- 5067 Paro Dr
- 6076 E Carpenter Rd
- 4455 N Genesee Rd
- 4413 Esta Dr
- 4452 Muriel Dr
- 4435 Meadowbrook Dr
- 0 Sugar Maple Farms Unit 50195365
- 4489 Home Town Dr Unit 32
- 4465 Market Place
- 4147 Independence Dr
- 6081 Stoney Point St
- 4123 Independence Dr
- 4155 Independence Dr
- 6067 Stoney Point St
- 6082 Stoney Point St
- 4148 Independence Dr
- 6088 Stoney Point St
- 4109 Independence Dr
- 4163 Independence Dr
- 4173 Independence Dr
- 4158 Independence Dr
- 6076 Stoney Point St
- 6059 Stoney Point St
- 4138 Independence Dr
- 4130 Independence Dr
- 6068 Stoney Point St
- 6070 Concord Pass
- 4122 Independence Dr
- 4099 Independence Dr
Your Personal Tour Guide
Ask me questions while you tour the home.