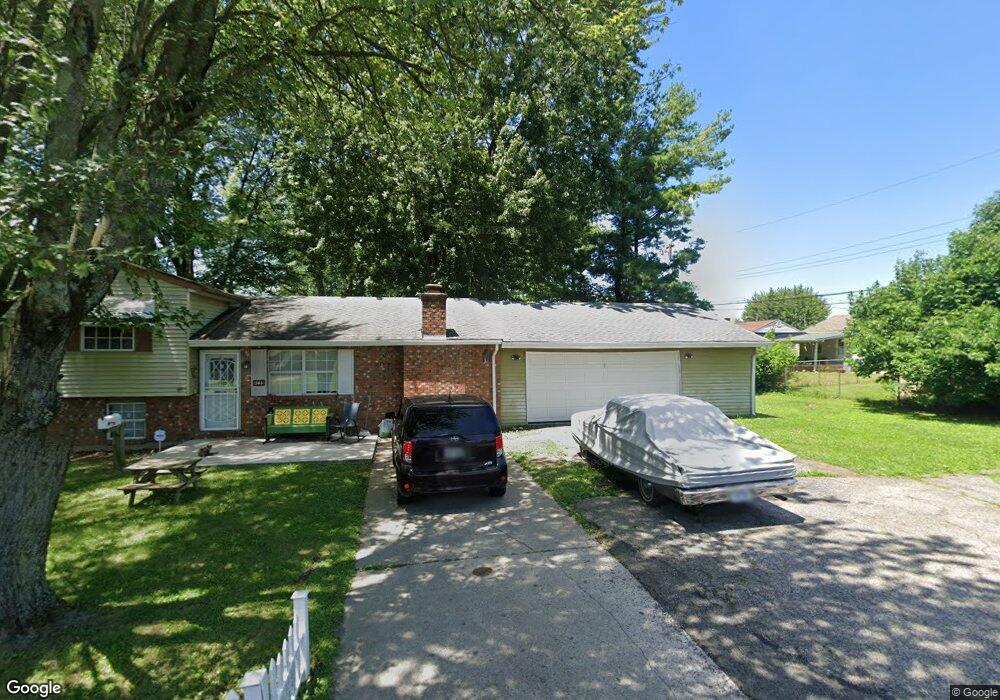
4135 Manor Rd Columbus, OH 43224
North Linden NeighborhoodEstimated Value: $238,000 - $252,000
3
Beds
2
Baths
1,660
Sq Ft
$147/Sq Ft
Est. Value
About This Home
This home is located at 4135 Manor Rd, Columbus, OH 43224 and is currently estimated at $243,777, approximately $146 per square foot. 4135 Manor Rd is a home located in Franklin County with nearby schools including North Linden Elementary School, Medina Middle School, and Mifflin High School.
Ownership History
Date
Name
Owned For
Owner Type
Purchase Details
Closed on
Apr 28, 2010
Sold by
The Bank Of New York
Bought by
Thomas Bret D
Current Estimated Value
Purchase Details
Closed on
Mar 11, 2010
Sold by
Johnson Janie Y and Drakes James A
Bought by
The Bank Of New York
Purchase Details
Closed on
Sep 23, 2004
Sold by
Pace Carl W and Pace Glen A
Bought by
Drakes James A and Johnson Janie Y
Home Financials for this Owner
Home Financials are based on the most recent Mortgage that was taken out on this home.
Original Mortgage
$84,400
Interest Rate
6.15%
Mortgage Type
New Conventional
Purchase Details
Closed on
Jun 17, 1997
Sold by
Stires Mary R
Bought by
Stires Mary R and Pace Carl W
Create a Home Valuation Report for This Property
The Home Valuation Report is an in-depth analysis detailing your home's value as well as a comparison with similar homes in the area
Home Values in the Area
Average Home Value in this Area
Purchase History
| Date | Buyer | Sale Price | Title Company |
|---|---|---|---|
| Thomas Bret D | $47,000 | None Available | |
| The Bank Of New York | $64,000 | None Available | |
| Drakes James A | $105,500 | Title First | |
| Stires Mary R | -- | -- |
Source: Public Records
Mortgage History
| Date | Status | Borrower | Loan Amount |
|---|---|---|---|
| Previous Owner | Drakes James A | $84,400 |
Source: Public Records
Tax History Compared to Growth
Tax History
| Year | Tax Paid | Tax Assessment Tax Assessment Total Assessment is a certain percentage of the fair market value that is determined by local assessors to be the total taxable value of land and additions on the property. | Land | Improvement |
|---|---|---|---|---|
| 2024 | $3,939 | $66,890 | $10,010 | $56,880 |
| 2023 | $3,898 | $66,885 | $10,010 | $56,875 |
| 2022 | $3,014 | $40,500 | $9,280 | $31,220 |
| 2021 | $3,019 | $40,500 | $9,280 | $31,220 |
| 2020 | $3,023 | $40,500 | $9,280 | $31,220 |
| 2019 | $2,611 | $32,310 | $7,420 | $24,890 |
| 2018 | $2,414 | $32,310 | $7,420 | $24,890 |
| 2017 | $2,608 | $32,310 | $7,420 | $24,890 |
| 2016 | $2,534 | $28,350 | $4,830 | $23,520 |
| 2015 | $2,219 | $28,350 | $4,830 | $23,520 |
| 2014 | $2,222 | $28,350 | $4,830 | $23,520 |
| 2013 | $1,212 | $31,500 | $5,355 | $26,145 |
Source: Public Records
Map
Nearby Homes
- 1863 Ward Rd
- 4111 Walford St
- 1734 Ferris Rd
- 1997 Ferris Rd
- 4217 Hickman Rd
- 2023 Ferris Rd
- 1936 Case Rd
- 4309 Walford St
- 1896 Ormond Ave
- 2144 Colfax Ave
- 2194 Ashley Dr
- 4057 Estates Place
- 2220 Sale Rd
- 2219 Sale Rd
- 2283 Ward Rd
- 3750 Dresden St
- 4143 Karl Rd Unit 314
- 4145 Karl Rd Unit 223
- 1496 E Cooke Rd
- 2015 Melrose Ave
- 1890 Lehner Rd
- 1900 Lehner Rd
- 1917 E Beaumont Rd
- 1911 E Beaumont Rd
- 1916 Lehner Rd
- 1903 E Beaumont Rd
- 1933 E Beaumont Rd
- 1878 Lehner Rd
- 1895 E Beaumont Rd
- 1920 Lehner Rd
- 1943 E Beaumont Rd
- 1887 E Beaumont Rd
- 1922 E Beaumont Rd
- 1914 E Beaumont Rd
- 1866 Lehner Rd
- 1901 Lehner Rd
- 4120 Manor Rd
- 1906 E Beaumont Rd
- 1951 E Beaumont Rd
- 1938 E Beaumont Rd