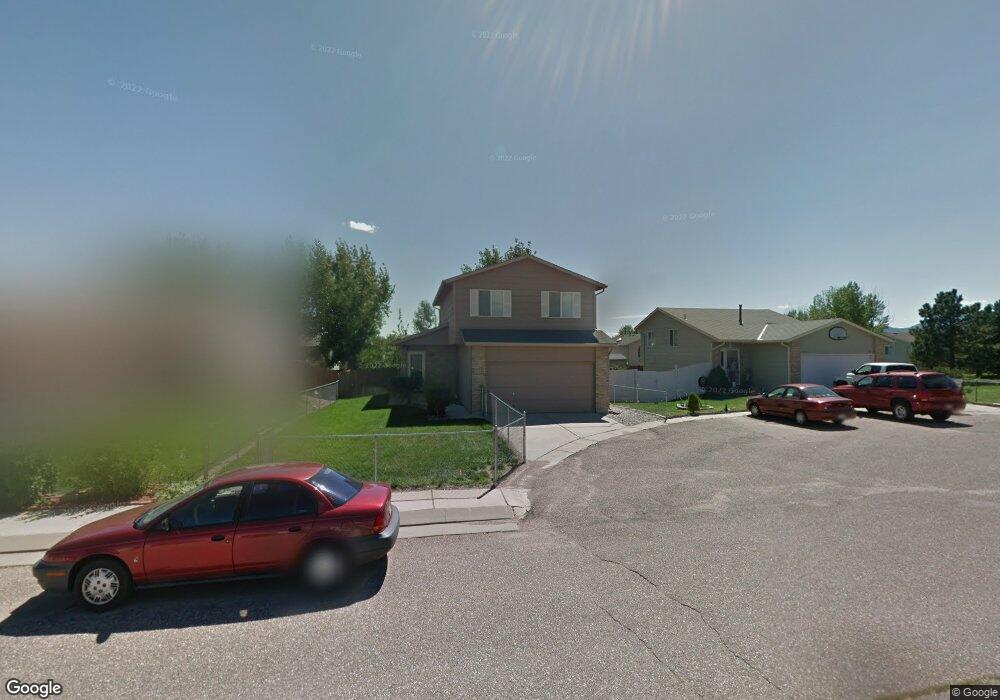
4135 Pele Ct Colorado Springs, CO 80911
Security-Widefield NeighborhoodEstimated Value: $329,000 - $405,000
3
Beds
2
Baths
1,330
Sq Ft
$273/Sq Ft
Est. Value
About This Home
This home is located at 4135 Pele Ct, Colorado Springs, CO 80911 and is currently estimated at $362,721, approximately $272 per square foot. 4135 Pele Ct is a home located in El Paso County with nearby schools including Pinello Elementary School, Sproul Junior High School, and Widefield High School.
Ownership History
Date
Name
Owned For
Owner Type
Purchase Details
Closed on
Mar 3, 2004
Sold by
Hud
Bought by
Hancock Alvin R
Current Estimated Value
Home Financials for this Owner
Home Financials are based on the most recent Mortgage that was taken out on this home.
Original Mortgage
$122,902
Outstanding Balance
$57,359
Interest Rate
5.65%
Mortgage Type
FHA
Estimated Equity
$305,362
Purchase Details
Closed on
Dec 4, 2003
Sold by
Makowski Robert T
Bought by
Hud
Purchase Details
Closed on
Jul 16, 2001
Sold by
Timm David Donald
Bought by
Makowski Robert T
Home Financials for this Owner
Home Financials are based on the most recent Mortgage that was taken out on this home.
Original Mortgage
$142,759
Interest Rate
7.18%
Mortgage Type
FHA
Purchase Details
Closed on
Apr 23, 1999
Sold by
The Range Company Llc
Bought by
Timm David Donald
Home Financials for this Owner
Home Financials are based on the most recent Mortgage that was taken out on this home.
Original Mortgage
$122,349
Interest Rate
7.07%
Mortgage Type
VA
Create a Home Valuation Report for This Property
The Home Valuation Report is an in-depth analysis detailing your home's value as well as a comparison with similar homes in the area
Home Values in the Area
Average Home Value in this Area
Purchase History
| Date | Buyer | Sale Price | Title Company |
|---|---|---|---|
| Hancock Alvin R | -- | Fahtco | |
| Hud | $156,184 | -- | |
| Makowski Robert T | $145,000 | First American | |
| Timm David Donald | $119,950 | North American Title Co |
Source: Public Records
Mortgage History
| Date | Status | Borrower | Loan Amount |
|---|---|---|---|
| Open | Hancock Alvin R | $122,902 | |
| Previous Owner | Makowski Robert T | $142,759 | |
| Previous Owner | Timm David Donald | $122,349 |
Source: Public Records
Tax History Compared to Growth
Tax History
| Year | Tax Paid | Tax Assessment Tax Assessment Total Assessment is a certain percentage of the fair market value that is determined by local assessors to be the total taxable value of land and additions on the property. | Land | Improvement |
|---|---|---|---|---|
| 2025 | $1,693 | $26,290 | -- | -- |
| 2024 | $1,637 | $26,510 | $4,020 | $22,490 |
| 2023 | $1,637 | $26,510 | $4,020 | $22,490 |
| 2022 | $1,345 | $18,010 | $2,780 | $15,230 |
| 2021 | $1,450 | $18,530 | $2,860 | $15,670 |
| 2020 | $1,155 | $14,340 | $2,500 | $11,840 |
| 2019 | $1,149 | $14,340 | $2,500 | $11,840 |
| 2018 | $1,013 | $11,800 | $1,870 | $9,930 |
| 2017 | $1,024 | $11,800 | $1,870 | $9,930 |
| 2016 | $824 | $11,590 | $1,990 | $9,600 |
| 2015 | $844 | $11,590 | $1,990 | $9,600 |
| 2014 | $738 | $10,170 | $1,790 | $8,380 |
Source: Public Records
Map
Nearby Homes
- 4226 Dooley Way
- 4145 Dooley Way
- 4331 Mcgrew Cir
- 4375 Cassidy St
- 4385 Cassidy St
- 4634 Cassidy St
- 4658 Hennings Dr
- 4666 Hennings Dr
- 2522 Ivanhoe Dr
- 4790 Hennings Dr
- 2246 Bison Dr
- 4613 Pleasant Port View Unit 2
- 213 Sumac Dr
- 4020 Silver Star Grove
- 4691 Pleasant Port View
- 324 Davie Dr
- 124 Sumac Dr
- 308 Steven Dr
- 105 Larch Dr
- 405 Birch Dr