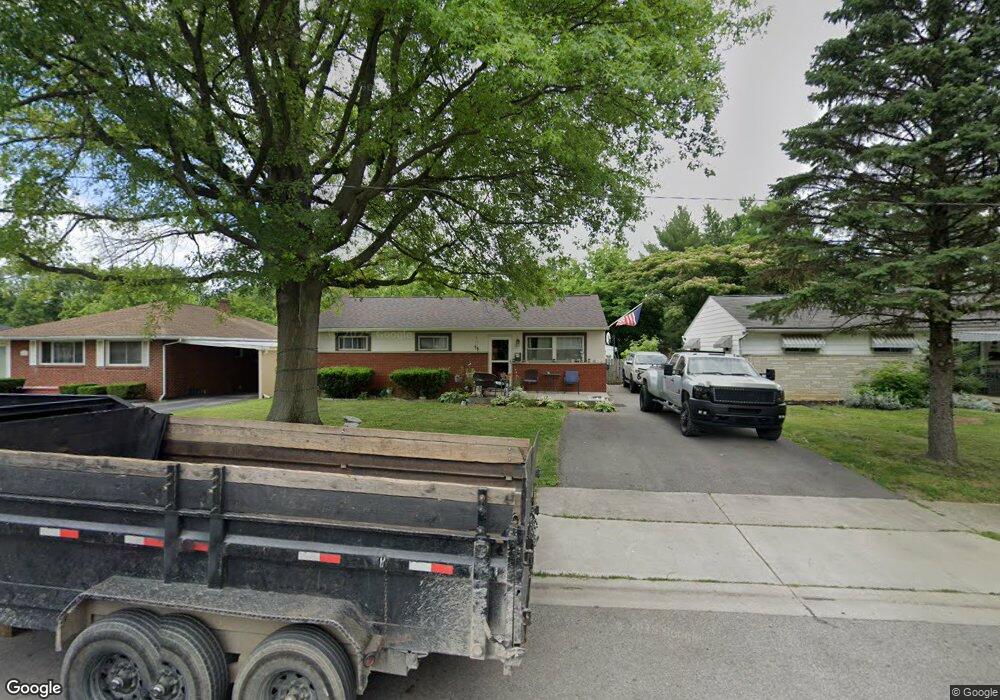
4136 Chandler Dr Columbus, OH 43213
Estimated Value: $193,000 - $254,000
3
Beds
1
Bath
1,134
Sq Ft
$189/Sq Ft
Est. Value
About This Home
This home is located at 4136 Chandler Dr, Columbus, OH 43213 and is currently estimated at $214,352, approximately $189 per square foot. 4136 Chandler Dr is a home located in Franklin County with nearby schools including Beechwood Elementary School, Etna Road Elementary School, and Rosemore Middle School.
Ownership History
Date
Name
Owned For
Owner Type
Purchase Details
Closed on
Jul 28, 2005
Sold by
Oliver George M and Estate Of George M Oliver Sr
Bought by
Arias Jose N
Current Estimated Value
Home Financials for this Owner
Home Financials are based on the most recent Mortgage that was taken out on this home.
Original Mortgage
$93,000
Outstanding Balance
$49,105
Interest Rate
5.74%
Mortgage Type
Fannie Mae Freddie Mac
Estimated Equity
$165,247
Purchase Details
Closed on
Jun 4, 2002
Sold by
Hoisington Mary E and Hoisington Mary E
Bought by
Oliver George M and Oliver George M
Home Financials for this Owner
Home Financials are based on the most recent Mortgage that was taken out on this home.
Original Mortgage
$69,500
Interest Rate
6.93%
Mortgage Type
Purchase Money Mortgage
Purchase Details
Closed on
May 16, 1985
Bought by
Hoisington Mary E
Create a Home Valuation Report for This Property
The Home Valuation Report is an in-depth analysis detailing your home's value as well as a comparison with similar homes in the area
Home Values in the Area
Average Home Value in this Area
Purchase History
| Date | Buyer | Sale Price | Title Company |
|---|---|---|---|
| Arias Jose N | $93,000 | Tradition | |
| Oliver George M | $79,500 | Lawyers Title | |
| Hoisington Mary E | -- | -- |
Source: Public Records
Mortgage History
| Date | Status | Borrower | Loan Amount |
|---|---|---|---|
| Open | Arias Jose N | $93,000 | |
| Previous Owner | Oliver George M | $69,500 |
Source: Public Records
Tax History Compared to Growth
Tax History
| Year | Tax Paid | Tax Assessment Tax Assessment Total Assessment is a certain percentage of the fair market value that is determined by local assessors to be the total taxable value of land and additions on the property. | Land | Improvement |
|---|---|---|---|---|
| 2024 | $2,724 | $62,300 | $18,200 | $44,100 |
| 2023 | $2,704 | $62,300 | $18,200 | $44,100 |
| 2022 | $2,197 | $38,470 | $6,200 | $32,270 |
| 2021 | $2,063 | $38,470 | $6,200 | $32,270 |
| 2020 | $2,043 | $38,470 | $6,200 | $32,270 |
| 2019 | $1,834 | $30,030 | $4,970 | $25,060 |
| 2018 | $1,797 | $30,030 | $4,970 | $25,060 |
| 2017 | $1,741 | $30,030 | $4,970 | $25,060 |
| 2016 | $1,711 | $26,190 | $5,500 | $20,690 |
| 2015 | $1,725 | $26,190 | $5,500 | $20,690 |
| 2014 | $1,726 | $26,190 | $5,500 | $20,690 |
| 2013 | $912 | $29,085 | $6,090 | $22,995 |
Source: Public Records
Map
Nearby Homes
- 4148 Elbern Ave
- 4154 Seigman Ave
- 4368 Broadhurst Dr
- 4489 Saint Margaret Ln
- 91 Robinwood Ave
- 451 Beaver Ave
- 579 Westphal Ave
- 3814 Elbern Ave
- 320 Collingwood Ave
- 4572 Saint Anthony Ln
- 526 Collingwood Ave
- 571 S Hamilton Rd
- 798 S Yearling Rd
- 91 Maplewood Ave
- 3811 Brentwood Ct
- 387 Shell Ct E
- 4094 E Main St
- 353 Shell Ct E
- 4653 Kae Ave
- 4144 Mcallister Ave
- 4142 Chandler Dr
- 4130 Chandler Dr
- 4137 Mayflower Blvd
- 4148 Chandler Dr
- 4175 Medway Ave
- 4125 Mayflower Blvd
- 4154 Chandler Dr
- 4127 Chandler Dr
- 4133 Chandler Dr
- 4121 Chandler Dr
- 4139 Chandler Dr
- 4115 Chandler Dr
- 4160 Chandler Dr
- 4193 Medway Ave
- 4145 Chandler Dr
- 4109 Chandler Dr
- 4130 Mayflower Blvd
- 4124 Mayflower Blvd
- 4151 Chandler Dr
- 4136 Mayflower Blvd