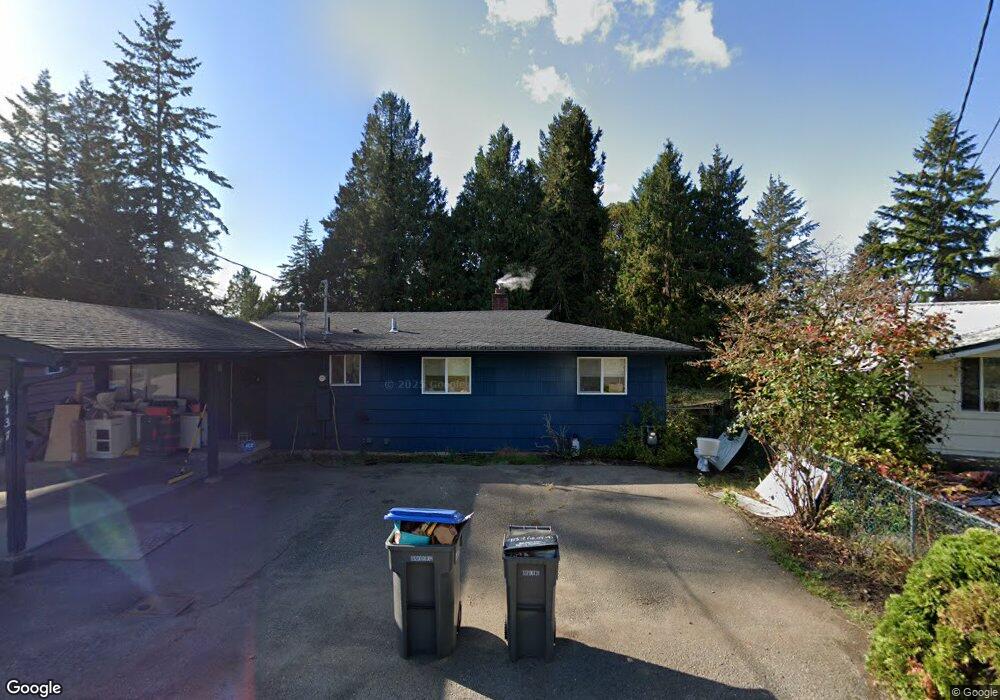
4137 17th St Unit A & B Bremerton, WA 98312
Estimated Value: $416,000 - $487,000
5
Beds
2
Baths
1,288
Sq Ft
$361/Sq Ft
Est. Value
About This Home
This home is located at 4137 17th St Unit A & B, Bremerton, WA 98312 and is currently estimated at $465,311, approximately $361 per square foot. 4137 17th St Unit A & B is a home located in Kitsap County with nearby schools including Crownhill Elementary School, Mountain View Middle School, and Bremerton High School.
Ownership History
Date
Name
Owned For
Owner Type
Purchase Details
Closed on
Aug 16, 2024
Sold by
Erickson Ray M and Erickson Ginny M
Bought by
Reeder Ryan Matthew and Rai Arya S
Current Estimated Value
Home Financials for this Owner
Home Financials are based on the most recent Mortgage that was taken out on this home.
Original Mortgage
$419,175
Outstanding Balance
$414,450
Interest Rate
6.89%
Mortgage Type
VA
Estimated Equity
$50,861
Purchase Details
Closed on
Nov 9, 2020
Sold by
Cato Sandra L and Cato Gregg M
Bought by
Erickson Ray M and Erickson Ginny M
Purchase Details
Closed on
Jun 1, 2000
Sold by
Polachek Jules J and Polachek Dawna K
Bought by
Cato Gregg M and Cato Sandra L
Home Financials for this Owner
Home Financials are based on the most recent Mortgage that was taken out on this home.
Original Mortgage
$82,300
Interest Rate
8.35%
Create a Home Valuation Report for This Property
The Home Valuation Report is an in-depth analysis detailing your home's value as well as a comparison with similar homes in the area
Home Values in the Area
Average Home Value in this Area
Purchase History
| Date | Buyer | Sale Price | Title Company |
|---|---|---|---|
| Reeder Ryan Matthew | $460,000 | Aegis Land Title | |
| Erickson Ray M | $385,000 | Land Title Company | |
| Cato Gregg M | $102,900 | Land Title Company |
Source: Public Records
Mortgage History
| Date | Status | Borrower | Loan Amount |
|---|---|---|---|
| Open | Reeder Ryan Matthew | $419,175 | |
| Previous Owner | Cato Gregg M | $82,300 |
Source: Public Records
Tax History Compared to Growth
Tax History
| Year | Tax Paid | Tax Assessment Tax Assessment Total Assessment is a certain percentage of the fair market value that is determined by local assessors to be the total taxable value of land and additions on the property. | Land | Improvement |
|---|---|---|---|---|
| 2026 | $3,837 | $435,020 | $89,760 | $345,260 |
| 2025 | $3,837 | $435,020 | $89,760 | $345,260 |
| 2024 | $3,703 | $435,020 | $89,760 | $345,260 |
| 2023 | $3,828 | $435,020 | $89,760 | $345,260 |
| 2022 | $3,556 | $363,330 | $74,800 | $288,530 |
| 2021 | $3,646 | $341,010 | $56,220 | $284,790 |
| 2020 | $3,386 | $316,390 | $52,030 | $264,360 |
| 2019 | $2,924 | $283,080 | $46,440 | $236,640 |
| 2018 | $3,065 | $194,840 | $34,920 | $159,920 |
| 2017 | $2,551 | $194,840 | $34,920 | $159,920 |
| 2016 | $2,385 | $172,420 | $30,630 | $141,790 |
| 2015 | $2,382 | $171,370 | $33,310 | $138,060 |
| 2014 | -- | $162,520 | $33,310 | $129,210 |
| 2013 | -- | $173,220 | $35,160 | $138,060 |
Source: Public Records
Map
Nearby Homes
- 4209 Kelly Rd
- 1818 Jackson Dr
- 2010 Shamrock Dr NW
- 2115 Rocky Point Rd NW Unit 26
- 2115 Rocky Point Rd NW Unit 22B
- 2115 Rocky Point Rd NW Unit 6
- 1135 Morgan Rd NW Unit A & B
- 2415 Rocky Point Rd NW
- 931 Oyster Bay Ct
- 923 Pershing Ave Unit 205
- 921 Pershing Ave Unit 203
- 2008 Madrona Point Dr
- 3201 17th St
- 2507 Rocky Point Rd NW
- 2117 E Phinney Bay Dr
- 1340 Shorewood Dr
- 500 N National Ave Unit 37
- 1309 Times Ave
- 1303 Times Ave
- 0 NW Shaw Island Way Unit NWM2369280