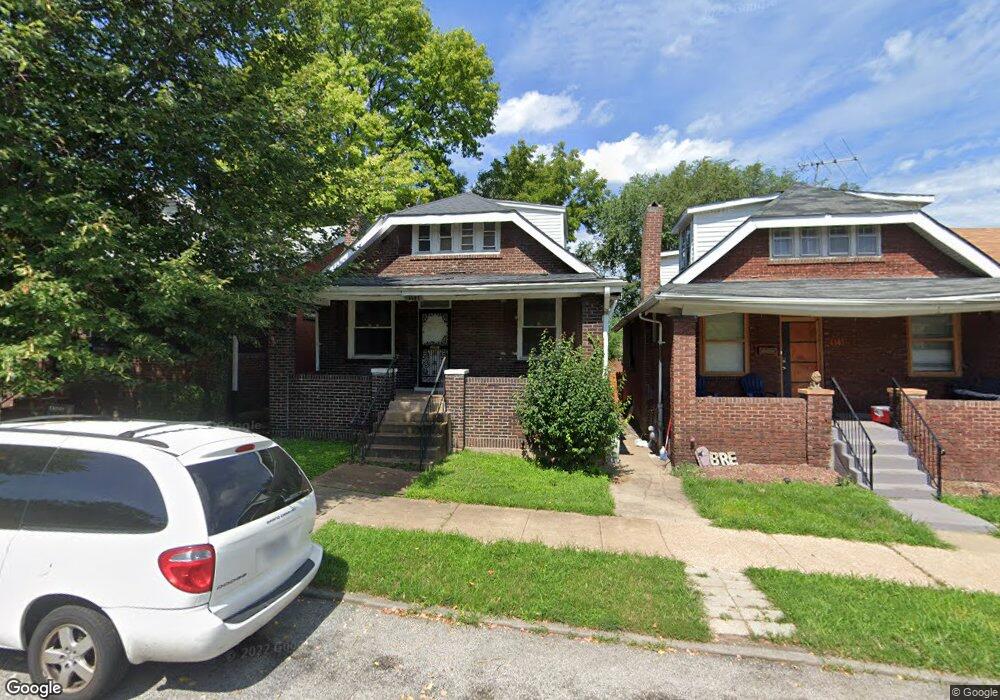
4137 N Taylor Ave Saint Louis, MO 63115
Penrose NeighborhoodEstimated Value: $50,000 - $74,000
3
Beds
2
Baths
875
Sq Ft
$71/Sq Ft
Est. Value
About This Home
This home is located at 4137 N Taylor Ave, Saint Louis, MO 63115 and is currently estimated at $61,925, approximately $70 per square foot. 4137 N Taylor Ave is a home located in St. Louis City with nearby schools including Ashland Elementary School, Yeatman-Liddell Middle School, and Sumner High School.
Ownership History
Date
Name
Owned For
Owner Type
Purchase Details
Closed on
May 6, 2020
Sold by
Francis Phelps Michael and Francis Rachelle
Bought by
Brick House Rental Property Ll
Current Estimated Value
Purchase Details
Closed on
Apr 30, 2020
Sold by
Francis Phelps Michael and Francis Rachelle
Bought by
Brick House Rental Property Ll
Purchase Details
Closed on
Apr 22, 2020
Sold by
Fifth Third Bank
Bought by
Philps Michael Francis
Purchase Details
Closed on
Nov 14, 2019
Sold by
Sproaps Jacqueline A
Bought by
Fifth Third Bank National Association
Purchase Details
Closed on
Jul 23, 2015
Sold by
Sproaps Jacqueline A
Bought by
Sproaps Lavonda
Purchase Details
Closed on
Jun 17, 2003
Sold by
Sproaps Jacqueline A and Garwood Anthony E
Bought by
Sproaps Jacqueline A
Create a Home Valuation Report for This Property
The Home Valuation Report is an in-depth analysis detailing your home's value as well as a comparison with similar homes in the area
Home Values in the Area
Average Home Value in this Area
Purchase History
| Date | Buyer | Sale Price | Title Company |
|---|---|---|---|
| Brick House Rental Property Ll | -- | None Listed On Document | |
| Brick House Rental Property Ll | -- | None Listed On Document | |
| Brick House Rental Property Llc | -- | None Available | |
| Philps Michael Francis | $15,000 | Servicelink Llc | |
| Fifth Third Bank National Association | $15,580 | None Available | |
| Sproaps Lavonda | -- | None Available | |
| Sproaps Jacqueline A | -- | -- |
Source: Public Records
Tax History Compared to Growth
Tax History
| Year | Tax Paid | Tax Assessment Tax Assessment Total Assessment is a certain percentage of the fair market value that is determined by local assessors to be the total taxable value of land and additions on the property. | Land | Improvement |
|---|---|---|---|---|
| 2025 | $276 | $3,060 | $440 | $2,620 |
| 2024 | $264 | $2,960 | $440 | $2,520 |
| 2023 | $264 | $2,960 | $440 | $2,520 |
| 2022 | $269 | $2,910 | $440 | $2,470 |
| 2021 | $268 | $2,910 | $440 | $2,470 |
| 2020 | $270 | $2,960 | $440 | $2,520 |
| 2019 | $270 | $2,970 | $440 | $2,530 |
| 2018 | $271 | $2,890 | $440 | $2,450 |
| 2017 | $267 | $2,890 | $440 | $2,450 |
| 2016 | $329 | $3,590 | $820 | $2,770 |
| 2015 | $300 | $3,590 | $820 | $2,770 |
| 2014 | $359 | $3,590 | $820 | $2,770 |
| 2013 | -- | $4,370 | $820 | $3,550 |
Source: Public Records
Map
Nearby Homes
- 4499 Lee Ave Unit B
- 4607 Lee Ave
- 4655 Lee Ave
- 4629 Farlin Ave
- 4477 Bessie Ave
- 4246 N Taylor Ave
- 3003 TAYOR N Taylor Ave
- 4534 Margaretta Ave
- 4681 Kossuth Ave
- 4429 Farlin Ave
- 4556 Carter Ave
- 4449 Anderson Ave
- 4707 Farlin Ave
- 4538 San Francisco Ave
- 4418 Dryden Ave
- 4627 Korte Ave
- 4416 San Francisco Ave
- 3624 N Taylor Ave
- 4237 Holly Ave
- 4430 Sexauer Ave
- 4141 N Taylor Ave
- 4133 N Taylor Ave
- 4143 N Taylor Ave
- 4129 N Taylor Ave
- 4132 Dryden Ave
- 4518 Lee Ave
- 4128 Dryden Ave
- 4124 Dryden Ave
- 4122 Dryden Ave
- 4132 N Taylor Ave
- 4130 N Taylor Ave
- 4128 N Taylor Ave
- 4126 N Taylor Ave
- 4118 Dryden Ave
- 4124 N Taylor Ave
- 4115 N Taylor Ave
- 4116 Dryden Ave
- 4120 N Taylor Ave
- 4118 N Taylor Ave
- 4111 N Taylor Ave