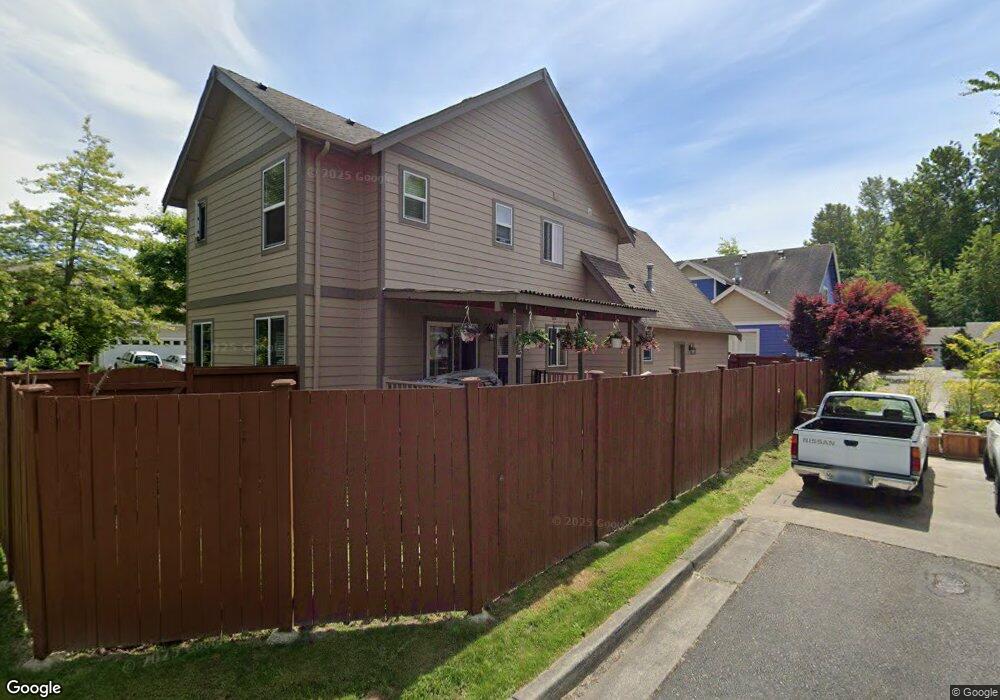
4137 Palisade Way Bellingham, WA 98226
Cordata NeighborhoodEstimated Value: $616,546 - $661,000
3
Beds
3
Baths
1,896
Sq Ft
$340/Sq Ft
Est. Value
About This Home
This home is located at 4137 Palisade Way, Bellingham, WA 98226 and is currently estimated at $644,637, approximately $339 per square foot. 4137 Palisade Way is a home located in Whatcom County with nearby schools including Cordata Elementary School, Shuksan Middle School, and Squalicum High School.
Ownership History
Date
Name
Owned For
Owner Type
Purchase Details
Closed on
Oct 14, 2020
Sold by
Singh Rakwinder and Cherwoo Dakshina
Bought by
Bui Tan and Ngo Oanh
Current Estimated Value
Home Financials for this Owner
Home Financials are based on the most recent Mortgage that was taken out on this home.
Original Mortgage
$355,900
Outstanding Balance
$316,554
Interest Rate
2.9%
Mortgage Type
New Conventional
Estimated Equity
$328,083
Purchase Details
Closed on
May 23, 2017
Sold by
Bains Bhupinder S and Bains Sukhivir K
Bought by
Singh Rakwinder and Cherwoo Dakshina
Home Financials for this Owner
Home Financials are based on the most recent Mortgage that was taken out on this home.
Original Mortgage
$289,750
Interest Rate
4.03%
Mortgage Type
New Conventional
Purchase Details
Closed on
May 12, 2006
Sold by
Lewsader Construction Llc
Bought by
Bains Bhupinder and Bains Sukhvir
Home Financials for this Owner
Home Financials are based on the most recent Mortgage that was taken out on this home.
Original Mortgage
$29,890
Interest Rate
6.3%
Mortgage Type
Credit Line Revolving
Create a Home Valuation Report for This Property
The Home Valuation Report is an in-depth analysis detailing your home's value as well as a comparison with similar homes in the area
Home Values in the Area
Average Home Value in this Area
Purchase History
| Date | Buyer | Sale Price | Title Company |
|---|---|---|---|
| Bui Tan | $465,000 | Chicago Title Company | |
| Singh Rakwinder | $305,000 | Chicago Title Insurance | |
| Bains Bhupinder | $299,180 | Stewart Title Company |
Source: Public Records
Mortgage History
| Date | Status | Borrower | Loan Amount |
|---|---|---|---|
| Open | Bui Tan | $355,900 | |
| Previous Owner | Singh Rakwinder | $289,750 | |
| Previous Owner | Bains Bhupinder | $29,890 | |
| Previous Owner | Bains Bhupinder | $239,120 |
Source: Public Records
Tax History Compared to Growth
Tax History
| Year | Tax Paid | Tax Assessment Tax Assessment Total Assessment is a certain percentage of the fair market value that is determined by local assessors to be the total taxable value of land and additions on the property. | Land | Improvement |
|---|---|---|---|---|
| 2024 | $4,744 | $583,824 | $211,408 | $372,416 |
| 2023 | $4,744 | $609,496 | $220,704 | $388,792 |
| 2022 | $4,104 | $534,646 | $193,600 | $341,046 |
| 2021 | $3,938 | $441,856 | $160,000 | $281,856 |
| 2020 | $3,806 | $400,129 | $112,933 | $287,196 |
| 2019 | $3,405 | $373,820 | $105,596 | $268,224 |
| 2018 | $3,524 | $335,290 | $94,721 | $240,569 |
| 2017 | $3,064 | $296,667 | $83,810 | $212,857 |
| 2016 | $2,804 | $269,584 | $76,270 | $193,314 |
| 2015 | $2,890 | $256,872 | $72,500 | $184,372 |
| 2014 | -- | $256,154 | $72,240 | $183,914 |
| 2013 | -- | $245,114 | $70,000 | $175,114 |
Source: Public Records
Map
Nearby Homes
- 617 Sunflower Ln Unit E2
- 516 Darby Dr Unit 207
- 516 Darby Dr Unit 213
- 516 Darby Dr Unit 104
- 512 Darby Dr Unit 213
- 512 Darby Dr Unit 111
- 512 Darby Dr Unit 212
- 4121 Village Dr Unit 9
- 500 Darby Dr Unit 304
- 500 Darby Dr Unit 210
- 500 Darby Dr Unit 314
- 504 Darby Dr Unit 110
- 1150 E Village Ln Unit A
- 4015 Eliza Ave Unit 120
- 4015 Eliza Ave Unit 31
- 1217 Garland Ln
- 0 Home Ln
- 4305 Sumac Ln
- 4252 Northwest Dr
- 5090 Festival Blvd Unit 1C
- 4131 Palisade Way
- 4145 Palisade Way
- 4129 Palisade Way
- 4138 Palisade Way
- 4134 Palisade Way
- 4149 Palisade Way
- 4144 Palisade Way
- 4127 Palisade Way
- 4130 Palisade Way
- 4125 Palisade Way
- 617 Rosette Ct
- 618 Sierra St
- 4121 Palisade Way
- 621 Sierra St
- 4123 Palisade Way
- 613 Rosette Ct
- 612 Sierra St
- 617 Sierra St
- 612 Rosette Ct