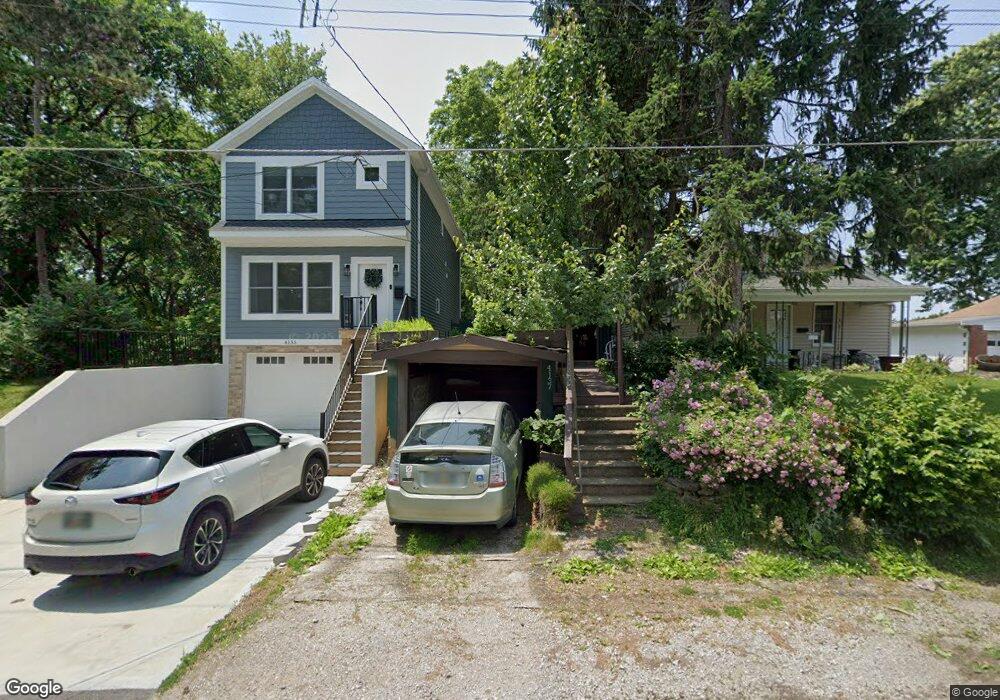
4137 Settle St Cincinnati, OH 45227
Madisonville NeighborhoodEstimated Value: $74,407 - $165,000
1
Bed
1
Bath
458
Sq Ft
$256/Sq Ft
Est. Value
About This Home
This home is located at 4137 Settle St, Cincinnati, OH 45227 and is currently estimated at $117,352, approximately $256 per square foot. 4137 Settle St is a home located in Hamilton County with nearby schools including John P. Parker School, Shroder High School, and Clark Montessori High School.
Ownership History
Date
Name
Owned For
Owner Type
Purchase Details
Closed on
Mar 6, 2023
Sold by
Stephan Claus
Bought by
Shaw Mary C
Current Estimated Value
Purchase Details
Closed on
Oct 11, 2022
Sold by
Foster Daric
Bought by
Stephan Claus
Purchase Details
Closed on
Jan 30, 2001
Sold by
Stephan Claus
Bought by
Foster Daric
Home Financials for this Owner
Home Financials are based on the most recent Mortgage that was taken out on this home.
Original Mortgage
$44,550
Interest Rate
7.22%
Purchase Details
Closed on
Dec 22, 2000
Sold by
Dwyer John
Bought by
Stephan Claus
Home Financials for this Owner
Home Financials are based on the most recent Mortgage that was taken out on this home.
Original Mortgage
$44,550
Interest Rate
7.22%
Purchase Details
Closed on
Aug 8, 2000
Sold by
Shahriar Abolfatzadeh and Shahriar Connie P
Bought by
Stephan Claus
Create a Home Valuation Report for This Property
The Home Valuation Report is an in-depth analysis detailing your home's value as well as a comparison with similar homes in the area
Home Values in the Area
Average Home Value in this Area
Purchase History
| Date | Buyer | Sale Price | Title Company |
|---|---|---|---|
| Shaw Mary C | $45,000 | None Listed On Document | |
| Shaw Mary C | $45,000 | None Listed On Document | |
| Stephan Claus | $42,000 | -- | |
| Stephan Claus | $42,000 | None Listed On Document | |
| Foster Daric | $49,900 | First Service Title Agency I | |
| Stephan Claus | $24,000 | -- | |
| Stephan Claus | $24,000 | -- |
Source: Public Records
Mortgage History
| Date | Status | Borrower | Loan Amount |
|---|---|---|---|
| Previous Owner | Foster Daric | $44,550 |
Source: Public Records
Tax History
| Year | Tax Paid | Tax Assessment Tax Assessment Total Assessment is a certain percentage of the fair market value that is determined by local assessors to be the total taxable value of land and additions on the property. | Land | Improvement |
|---|---|---|---|---|
| 2025 | $895 | $24,613 | $7,095 | $17,518 |
| 2024 | $874 | $24,613 | $7,095 | $17,518 |
| 2023 | $1,565 | $24,613 | $7,095 | $17,518 |
| 2022 | $1,472 | $21,536 | $3,497 | $18,039 |
| 2021 | $1,417 | $21,536 | $3,497 | $18,039 |
| 2020 | $1,457 | $21,536 | $3,497 | $18,039 |
| 2019 | $1,409 | $19,058 | $3,094 | $15,964 |
| 2018 | $1,411 | $19,058 | $3,094 | $15,964 |
| 2017 | $1,341 | $19,058 | $3,094 | $15,964 |
| 2016 | $1,154 | $16,142 | $2,954 | $13,188 |
| 2015 | $1,040 | $16,142 | $2,954 | $13,188 |
| 2014 | $1,047 | $16,142 | $2,954 | $13,188 |
| 2013 | $1,035 | $15,670 | $2,867 | $12,803 |
Source: Public Records
Map
Nearby Homes
- 6613 Bramble Ave
- 4115 Homer Ave
- 6497 Merwin Ave
- 6208 Bancroft St
- 4424 Simpson Ave
- 6017 Bramble Ave
- 3723 Carlton Ave
- 3730 Simpson Ave
- 3715 Simpson Ave
- 4609 Winona Terrace
- 6307 Wooster Pike
- 6121 Roe St
- 3645 Birkdale Ln
- 3710 Watterson Rd
- 3669 Birkdale Ln
- 3910 Germania St
- 3665 Birkdale Ln
- 4614 Simpson Ave
- 3662 Birkdale Ln
- 3657 Birkdale Ln
Your Personal Tour Guide
Ask me questions while you tour the home.