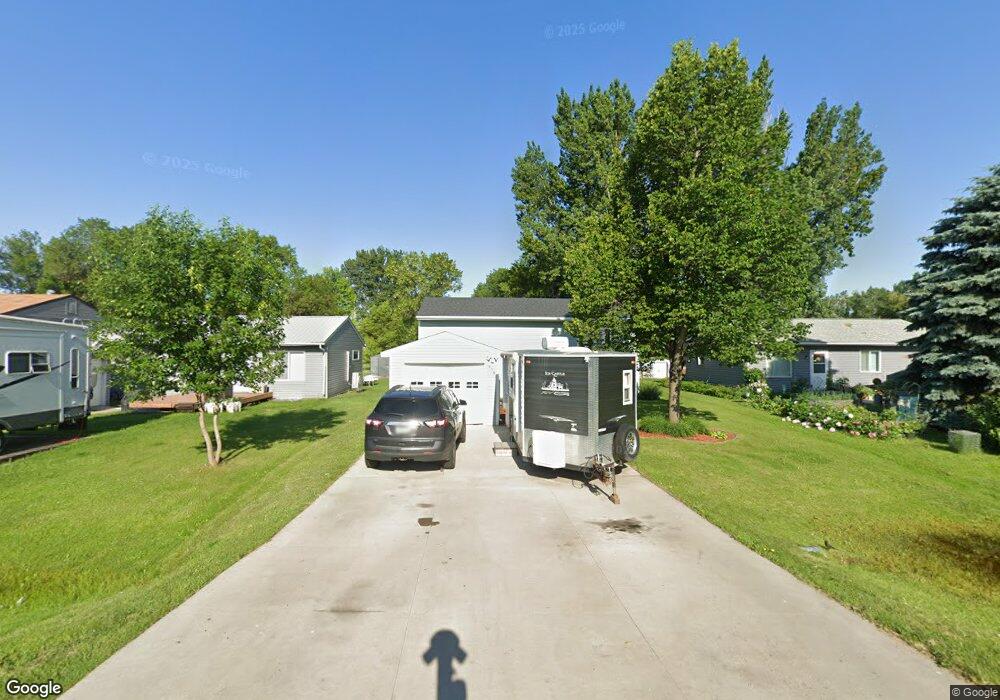
414 3rd Ave Mapleton, ND 58059
Estimated Value: $222,000 - $452,000
4
Beds
2
Baths
1,824
Sq Ft
$159/Sq Ft
Est. Value
About This Home
This home is located at 414 3rd Ave, Mapleton, ND 58059 and is currently estimated at $290,904, approximately $159 per square foot. 414 3rd Ave is a home located in Cass County with nearby schools including Mapleton Elementary School.
Ownership History
Date
Name
Owned For
Owner Type
Purchase Details
Closed on
Jul 18, 2007
Sold by
Federal National Mortgage Association
Bought by
Warm David and Warm Alessandra
Current Estimated Value
Home Financials for this Owner
Home Financials are based on the most recent Mortgage that was taken out on this home.
Original Mortgage
$112,035
Outstanding Balance
$91,823
Interest Rate
6.54%
Mortgage Type
New Conventional
Estimated Equity
$199,081
Purchase Details
Closed on
May 17, 2007
Sold by
Duurmsa Michael and Duurmsa Channon
Bought by
Everhome Mortgage Corp
Purchase Details
Closed on
Apr 30, 2007
Sold by
Everhome Mortgage Corp
Bought by
Federal National Mortgage Association
Purchase Details
Closed on
Jun 23, 2005
Sold by
Tykwinski Adam J and Tykwinski Nancy L
Bought by
Duursma Michael and Duursma Channon
Home Financials for this Owner
Home Financials are based on the most recent Mortgage that was taken out on this home.
Original Mortgage
$102,900
Interest Rate
5.87%
Mortgage Type
New Conventional
Create a Home Valuation Report for This Property
The Home Valuation Report is an in-depth analysis detailing your home's value as well as a comparison with similar homes in the area
Purchase History
| Date | Buyer | Sale Price | Title Company |
|---|---|---|---|
| Warm David | -- | -- | |
| Everhome Mortgage Corp | $112,476 | -- | |
| Federal National Mortgage Association | -- | -- | |
| Duursma Michael | -- | -- |
Source: Public Records
Mortgage History
| Date | Status | Borrower | Loan Amount |
|---|---|---|---|
| Open | Warm David | $112,035 | |
| Previous Owner | Duursma Michael | $102,900 |
Source: Public Records
Tax History
| Year | Tax Paid | Tax Assessment Tax Assessment Total Assessment is a certain percentage of the fair market value that is determined by local assessors to be the total taxable value of land and additions on the property. | Land | Improvement |
|---|---|---|---|---|
| 2024 | $2,578 | $98,750 | $14,800 | $83,950 |
| 2023 | $3,034 | $99,000 | $14,800 | $84,200 |
| 2022 | $2,637 | $90,700 | $14,800 | $75,900 |
| 2021 | $2,496 | $82,350 | $11,450 | $70,900 |
| 2020 | $2,389 | $80,150 | $11,450 | $68,700 |
| 2019 | $2,391 | $80,150 | $11,450 | $68,700 |
| 2018 | $2,417 | $80,150 | $11,450 | $68,700 |
| 2017 | $2,296 | $79,400 | $11,450 | $67,950 |
| 2016 | $1,431 | $69,100 | $7,150 | $61,950 |
| 2015 | $1,267 | $63,950 | $6,600 | $57,350 |
| 2014 | $1,238 | $58,150 | $6,000 | $52,150 |
| 2013 | $1,356 | $58,150 | $6,000 | $52,150 |
Source: Public Records
Map
Nearby Homes
Your Personal Tour Guide
Ask me questions while you tour the home.