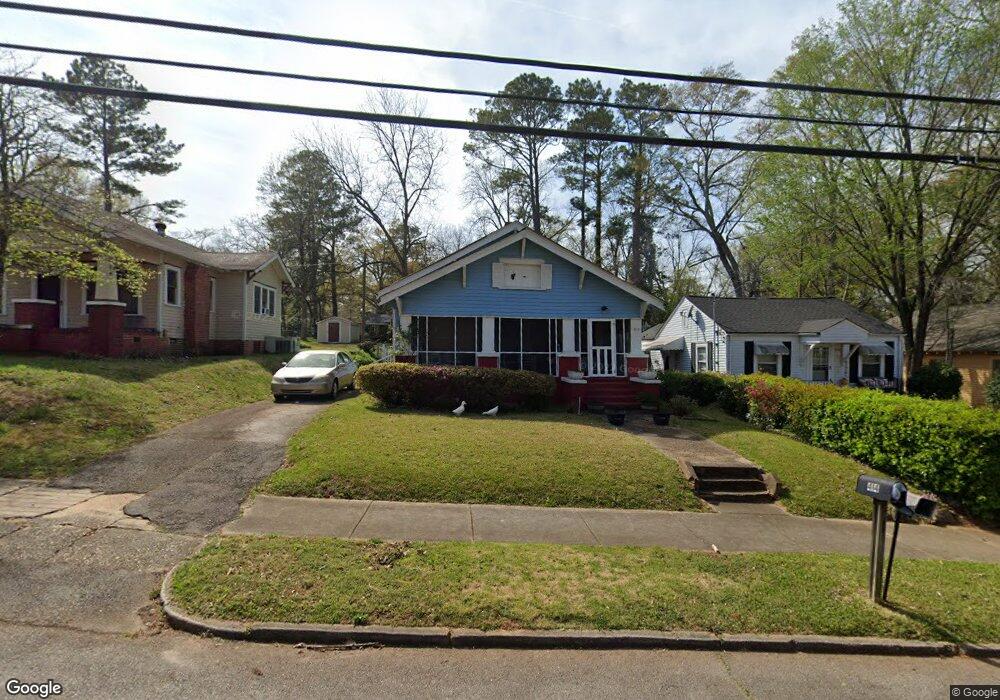
414 Alford St Lagrange, GA 30240
Estimated Value: $118,722 - $168,000
3
Beds
1
Bath
1,332
Sq Ft
$106/Sq Ft
Est. Value
About This Home
This home is located at 414 Alford St, Lagrange, GA 30240 and is currently estimated at $140,681, approximately $105 per square foot. 414 Alford St is a home located in Troup County with nearby schools including Ethel W. Kight Elementary School, Hollis Hand Elementary School, and Franklin Forest Elementary School.
Ownership History
Date
Name
Owned For
Owner Type
Purchase Details
Closed on
Nov 27, 1995
Sold by
Aspinwall
Bought by
Harris Debra A
Current Estimated Value
Purchase Details
Closed on
Nov 10, 1995
Sold by
Peggy D Mcgee
Bought by
Aspinwall
Purchase Details
Closed on
Nov 9, 1995
Sold by
James R Aspinwall
Bought by
Peggy D Mcgee
Purchase Details
Closed on
Jun 27, 1995
Sold by
Donna D Goodson
Bought by
James R Aspinwall
Purchase Details
Closed on
Nov 18, 1992
Sold by
Mcgee J
Bought by
Donna D Goodson
Purchase Details
Closed on
Dec 1, 1985
Sold by
Mcgee John and Mcgee Peggy
Bought by
Mcgee J
Purchase Details
Closed on
Jan 1, 1978
Sold by
Howard Ira Lee
Bought by
Mcgee John and Mcgee Peggy
Purchase Details
Closed on
Feb 19, 1974
Sold by
Will Of W E Howard
Bought by
Howard Ira Lee
Purchase Details
Closed on
May 1, 1967
Sold by
Howard Mrs Annie L
Bought by
Will Of W E Howard
Create a Home Valuation Report for This Property
The Home Valuation Report is an in-depth analysis detailing your home's value as well as a comparison with similar homes in the area
Purchase History
| Date | Buyer | Sale Price | Title Company |
|---|---|---|---|
| Harris Debra A | -- | -- | |
| Aspinwall | -- | -- | |
| Peggy D Mcgee | $41,700 | -- | |
| James R Aspinwall | $155,000 | -- | |
| Donna D Goodson | -- | -- | |
| Mcgee J | -- | -- | |
| Mcgee John | -- | -- | |
| Howard Ira Lee | -- | -- | |
| Will Of W E Howard | -- | -- |
Source: Public Records
Tax History
| Year | Tax Paid | Tax Assessment Tax Assessment Total Assessment is a certain percentage of the fair market value that is determined by local assessors to be the total taxable value of land and additions on the property. | Land | Improvement |
|---|---|---|---|---|
| 2025 | $926 | $33,940 | $2,960 | $30,980 |
| 2024 | $887 | $32,540 | $2,960 | $29,580 |
| 2023 | $813 | $29,820 | $2,960 | $26,860 |
| 2022 | $791 | $28,340 | $2,960 | $25,380 |
| 2021 | $509 | $16,884 | $2,960 | $13,924 |
| 2020 | $509 | $16,884 | $2,960 | $13,924 |
| 2019 | $483 | $16,000 | $2,960 | $13,040 |
| 2018 | $483 | $16,016 | $3,000 | $13,016 |
| 2017 | $483 | $16,016 | $3,000 | $13,016 |
| 2016 | $479 | $15,866 | $3,000 | $12,866 |
| 2015 | $479 | $15,858 | $2,992 | $12,866 |
| 2014 | $459 | $15,181 | $2,992 | $12,189 |
| 2013 | -- | $17,717 | $3,000 | $14,717 |
Source: Public Records
Map
Nearby Homes
- 207 Wilkes St
- 304 Boulevard
- 421 College Ave
- 208 Boulevard
- 403 College Ave
- 509 S Lewis St
- 600 Park Ave
- 505 S Lewis St
- 405 W Broome St Unit 2
- 405 W Broome St Unit 3
- 405 W Broome St Unit 4
- 405 W Broome St Unit 1
- 405 W Broome St Unit 5
- 206 Broad St
- 812 Elm St
- TRACT 1 W Haralson St
- 914 Todd St
- 501 Milam St
- 606 Poplar St
- 217 Jefferson St
Your Personal Tour Guide
Ask me questions while you tour the home.