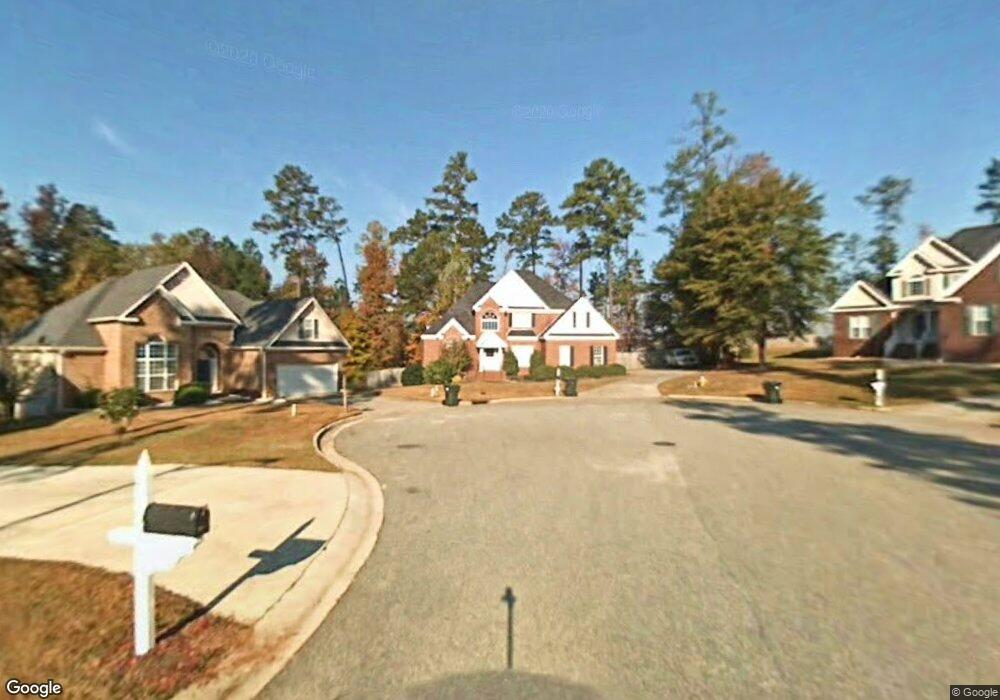
414 Amberly Ct Unit 204-A19 Macon, GA 31210
Estimated Value: $335,899 - $367,000
5
Beds
3
Baths
2,607
Sq Ft
$132/Sq Ft
Est. Value
About This Home
This home is located at 414 Amberly Ct Unit 204-A19, Macon, GA 31210 and is currently estimated at $343,975, approximately $131 per square foot. 414 Amberly Ct Unit 204-A19 is a home located in Bibb County with nearby schools including Springdale Elementary School, Howard Middle School, and Howard High School.
Ownership History
Date
Name
Owned For
Owner Type
Purchase Details
Closed on
Dec 15, 2020
Sold by
Ali Davide Carlo and Filipponi Silvia
Bought by
Green Eric
Current Estimated Value
Home Financials for this Owner
Home Financials are based on the most recent Mortgage that was taken out on this home.
Original Mortgage
$224,175
Outstanding Balance
$199,939
Interest Rate
2.8%
Mortgage Type
New Conventional
Estimated Equity
$144,037
Purchase Details
Closed on
Sep 28, 2018
Sold by
Ali Davide Carlo
Bought by
Ali Davide Carlo
Purchase Details
Closed on
Sep 21, 2018
Sold by
North Macon Properties Llc
Bought by
Ali David Carlo
Purchase Details
Closed on
Jul 6, 2004
Bought by
North Macon Properties Llc
Purchase Details
Closed on
Sep 24, 2003
Purchase Details
Closed on
Sep 30, 1997
Purchase Details
Closed on
Jun 3, 1997
Create a Home Valuation Report for This Property
The Home Valuation Report is an in-depth analysis detailing your home's value as well as a comparison with similar homes in the area
Home Values in the Area
Average Home Value in this Area
Purchase History
| Date | Buyer | Sale Price | Title Company |
|---|---|---|---|
| Green Eric | $236,500 | None Available | |
| Ali Davide Carlo | -- | None Available | |
| Ali David Carlo | $196,000 | None Available | |
| North Macon Properties Llc | $250,000 | -- | |
| -- | $250,000 | -- | |
| -- | $164,600 | -- | |
| -- | $24,000 | -- |
Source: Public Records
Mortgage History
| Date | Status | Borrower | Loan Amount |
|---|---|---|---|
| Open | Green Eric | $224,175 |
Source: Public Records
Tax History Compared to Growth
Tax History
| Year | Tax Paid | Tax Assessment Tax Assessment Total Assessment is a certain percentage of the fair market value that is determined by local assessors to be the total taxable value of land and additions on the property. | Land | Improvement |
|---|---|---|---|---|
| 2024 | $2,722 | $114,181 | $12,000 | $102,181 |
| 2023 | $2,265 | $114,181 | $12,000 | $102,181 |
| 2022 | $3,374 | $104,458 | $10,800 | $93,658 |
| 2021 | $3,080 | $88,048 | $10,000 | $78,048 |
| 2020 | $2,844 | $80,243 | $10,000 | $70,243 |
| 2019 | $2,795 | $80,243 | $10,000 | $70,243 |
| 2018 | $4,951 | $79,588 | $10,000 | $69,588 |
| 2017 | $2,837 | $75,722 | $10,000 | $65,722 |
| 2016 | $2,486 | $71,856 | $10,000 | $61,856 |
| 2015 | $3,510 | $71,675 | $10,000 | $61,675 |
| 2014 | $3,704 | $75,530 | $10,000 | $65,530 |
Source: Public Records
Map
Nearby Homes
- 504 Edgefield Way
- 169 Brookefield Dr
- 630 Millrun Ct
- 2080 Bowman Park
- 104 Palmer Dr
- 105 Wexford Cir
- 224 Chadwick Cir
- 578 Edgefield Way
- 203 Chadwick Cir
- 310 Chadwick Ct
- 135 Chadwick Dr
- 171 Lake View Dr N
- 123 Saddle Run Ct
- 1375 Bass Rd
- 1643 Wesleyan Hills Dr
- 115 Saddle Run Ct
- 4265 Sheraton Dr
- 1418 Craddock Way
- 414 Amberly Ct
- 409 Amberly Ct
- 408 Amberly Ct
- 405 Amberly Ct
- 405 Amberly Ct Unit A21
- 500 Edgefield Way
- 404 Amberly Ct
- 0 Amberly Ct
- 508 Edgefield Way
- 147 Brookefield Dr
- 309 Millwood Ct
- 151 Brookefield Dr
- 305 Millwood Ct
- 141 Brookefield Dr
- 155 Brookefield Dr
- 135 Brookefield Dr
- 131 Brookefield Dr
- 0 Brookefield Dr Unit 7529187
- 0 Brookefield Dr Unit 8474555
- 0 Brookefield Dr Unit 7085312