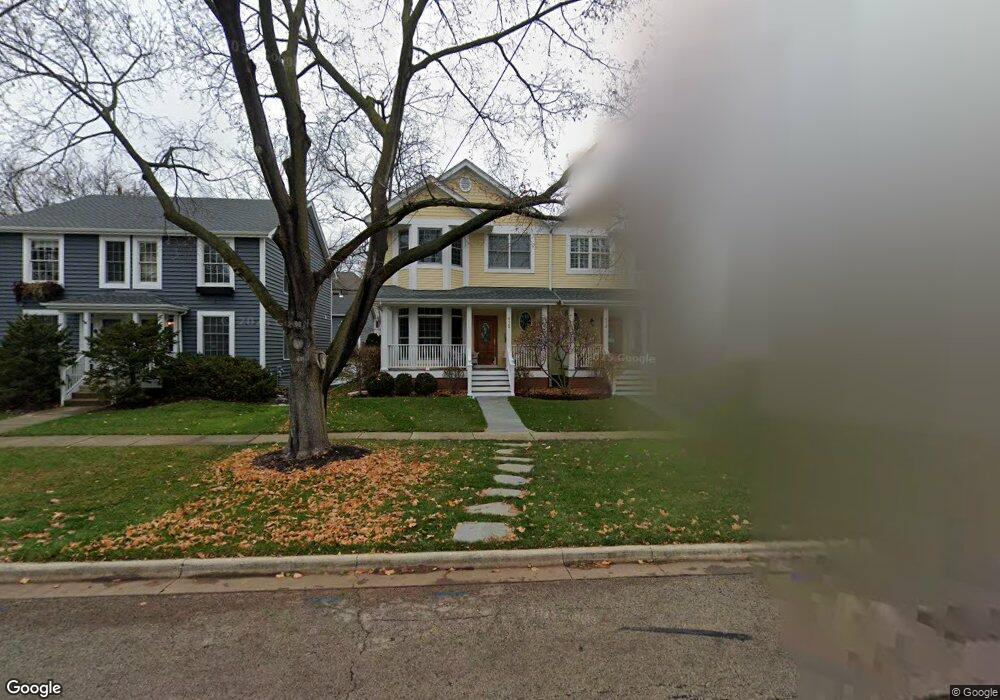
414 Broadway St Libertyville, IL 60048
Estimated Value: $688,060 - $813,000
4
Beds
3
Baths
2,237
Sq Ft
$333/Sq Ft
Est. Value
About This Home
This home is located at 414 Broadway St, Libertyville, IL 60048 and is currently estimated at $744,015, approximately $332 per square foot. 414 Broadway St is a home located in Lake County with nearby schools including Butterfield School, Highland Middle School, and Libertyville High School.
Ownership History
Date
Name
Owned For
Owner Type
Purchase Details
Closed on
Aug 9, 2017
Sold by
Comilla Laura Ann
Bought by
Comilla Laura Ann and The Laura Ann Comilla Revocabl
Current Estimated Value
Purchase Details
Closed on
Oct 16, 2008
Sold by
Kendall Jonathan D and Kendall Amy C
Bought by
Comilla Laura
Home Financials for this Owner
Home Financials are based on the most recent Mortgage that was taken out on this home.
Original Mortgage
$391,920
Outstanding Balance
$243,680
Interest Rate
5.12%
Mortgage Type
Purchase Money Mortgage
Estimated Equity
$500,335
Purchase Details
Closed on
Mar 6, 2006
Sold by
Christensen Kirk
Bought by
Kendall Jonathan D and Kendall Amy C
Home Financials for this Owner
Home Financials are based on the most recent Mortgage that was taken out on this home.
Original Mortgage
$360,000
Interest Rate
6.38%
Mortgage Type
Fannie Mae Freddie Mac
Create a Home Valuation Report for This Property
The Home Valuation Report is an in-depth analysis detailing your home's value as well as a comparison with similar homes in the area
Home Values in the Area
Average Home Value in this Area
Purchase History
| Date | Buyer | Sale Price | Title Company |
|---|---|---|---|
| Comilla Laura Ann | -- | None Available | |
| Comilla Laura | $490,000 | None Available | |
| Kendall Jonathan D | $482,500 | St |
Source: Public Records
Mortgage History
| Date | Status | Borrower | Loan Amount |
|---|---|---|---|
| Open | Comilla Laura | $391,920 | |
| Previous Owner | Kendall Jonathan D | $360,000 |
Source: Public Records
Tax History Compared to Growth
Tax History
| Year | Tax Paid | Tax Assessment Tax Assessment Total Assessment is a certain percentage of the fair market value that is determined by local assessors to be the total taxable value of land and additions on the property. | Land | Improvement |
|---|---|---|---|---|
| 2024 | $14,481 | $203,621 | $52,348 | $151,273 |
| 2023 | $14,147 | $187,808 | $48,283 | $139,525 |
| 2022 | $14,147 | $182,885 | $46,408 | $136,477 |
| 2021 | $13,109 | $178,948 | $45,409 | $133,539 |
| 2020 | $13,109 | $175,940 | $44,646 | $131,294 |
| 2019 | $12,783 | $174,267 | $44,221 | $130,046 |
| 2018 | $10,855 | $153,786 | $46,000 | $107,786 |
| 2017 | $10,704 | $148,931 | $44,548 | $104,383 |
| 2016 | $10,347 | $141,207 | $42,238 | $98,969 |
| 2015 | $10,251 | $131,981 | $39,478 | $92,503 |
| 2014 | $9,723 | $120,565 | $36,063 | $84,502 |
| 2012 | $9,390 | $124,094 | $37,119 | $86,975 |
Source: Public Records
Map
Nearby Homes
- 601 Broadway St
- 112 3rd St
- 121 4th St
- 217 E Church St
- 224 Newberry Ave
- 401 S 4th Ave
- 212 Elm Ct
- 426 S Milwaukee Ave
- 1754 Glenmore Rd
- 785 Meadow Ln
- 308 Mckinley Ave
- 505 Lange Ct
- 420 W Cook Ave
- 922 N Milwaukee Ave Unit A
- 837 E Rockland Rd
- 204 W Ellis Ave
- 1211 Parliament Ct
- 208 W Ellis Ave
- 212 W Ellis Ave
- 551 W Park Ave Unit E