Estimated Value: $137,000 - $209,000
4
Beds
2
Baths
1,672
Sq Ft
$106/Sq Ft
Est. Value
About This Home
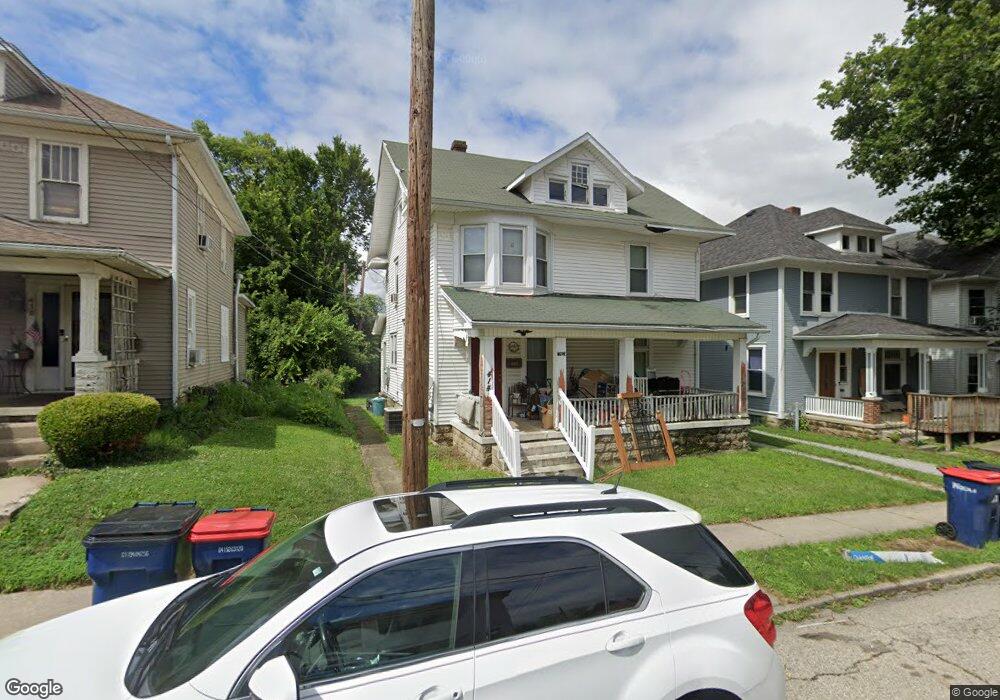
This home is located at 414 Camp St, Piqua, OH 45356 and is currently estimated at $178,030, approximately $106 per square foot. 414 Camp St is a home located in Miami County with nearby schools including Piqua Central Intermediate School, Springcreek Primary School, and Piqua Junior High School.
Ownership History
Date
Name
Owned For
Owner Type
Purchase Details
Closed on
May 18, 2010
Sold by
Mlj Group Inc
Bought by
Hernandez Megan R
Current Estimated Value
Home Financials for this Owner
Home Financials are based on the most recent Mortgage that was taken out on this home.
Original Mortgage
$83,870
Outstanding Balance
$55,430
Interest Rate
5.16%
Mortgage Type
FHA
Estimated Equity
$122,600
Purchase Details
Closed on
Oct 15, 2009
Sold by
Citifinancial Inc
Bought by
Mlj Group Inc
Purchase Details
Closed on
Jan 12, 2009
Sold by
Colgrove Mary J
Bought by
Citifinancial Inc
Purchase Details
Closed on
Nov 27, 2000
Sold by
Colgrove William R and Colgrove Treva
Bought by
Colgrove Mary J
Purchase Details
Closed on
Oct 29, 1992
Bought by
Colgrove William R
Create a Home Valuation Report for This Property
The Home Valuation Report is an in-depth analysis detailing your home's value as well as a comparison with similar homes in the area
Home Values in the Area
Average Home Value in this Area
Purchase History
| Date | Buyer | Sale Price | Title Company |
|---|---|---|---|
| Hernandez Megan R | $85,000 | -- | |
| Mlj Group Inc | $30,150 | -- | |
| Citifinancial Inc | $44,000 | -- | |
| Colgrove Mary J | $45,000 | -- | |
| Colgrove William R | $44,500 | -- |
Source: Public Records
Mortgage History
| Date | Status | Borrower | Loan Amount |
|---|---|---|---|
| Open | Colgrove Mary J | $83,870 | |
| Closed | Colgrove Mary J | $0 |
Source: Public Records
Tax History
| Year | Tax Paid | Tax Assessment Tax Assessment Total Assessment is a certain percentage of the fair market value that is determined by local assessors to be the total taxable value of land and additions on the property. | Land | Improvement |
|---|---|---|---|---|
| 2025 | $1,693 | $45,570 | $6,160 | $39,410 |
| 2024 | $1,693 | $38,680 | $6,650 | $32,030 |
| 2023 | $1,674 | $38,680 | $6,650 | $32,030 |
| 2022 | $1,660 | $38,680 | $6,650 | $32,030 |
| 2021 | $1,402 | $29,750 | $5,110 | $24,640 |
| 2020 | $1,375 | $29,750 | $5,110 | $24,640 |
| 2019 | $1,382 | $29,750 | $5,110 | $24,640 |
| 2018 | $1,411 | $29,020 | $5,320 | $23,700 |
| 2017 | $1,428 | $29,020 | $5,320 | $23,700 |
| 2016 | $1,413 | $29,020 | $5,320 | $23,700 |
| 2015 | $1,391 | $27,900 | $5,110 | $22,790 |
| 2014 | $1,391 | $27,900 | $5,110 | $22,790 |
| 2013 | $1,395 | $27,900 | $5,110 | $22,790 |
Source: Public Records
Map
Nearby Homes
- 412 Camp St
- 931 Caldwell St
- 419 Riverside Dr
- 454 Riverside Dr
- 651 N Downing St Unit 8
- 630 Boone St
- 522 W North St
- 107 Riverside Dr
- 651 Boone St
- 505 Scott St
- 615 N Wayne St
- 735 Park Ave
- 333 W Greene St
- 423 N Wayne St
- 908 Camp St
- 1307 Walker St
- 924 W North St
- 825 W Greene St
- 523 Harrison St
- 211 Franklin St
Your Personal Tour Guide
Ask me questions while you tour the home.