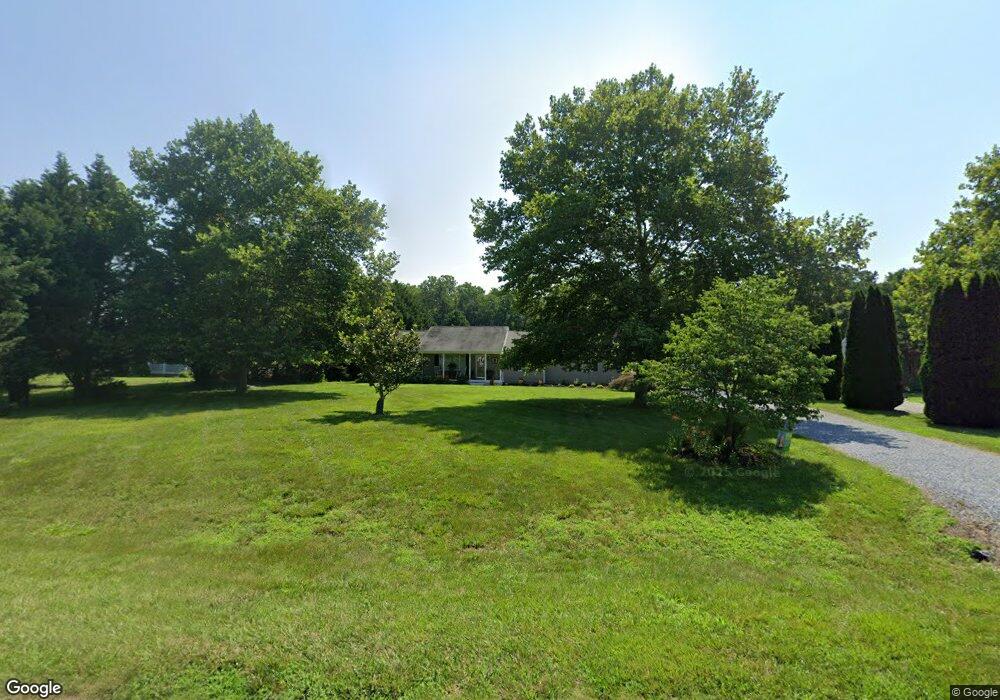
414 Denwood Ave Centreville, MD 21617
Estimated Value: $384,000 - $403,000
--
Bed
2
Baths
1,400
Sq Ft
$282/Sq Ft
Est. Value
About This Home
This home is located at 414 Denwood Ave, Centreville, MD 21617 and is currently estimated at $394,626, approximately $281 per square foot. 414 Denwood Ave is a home located in Queen Anne's County with nearby schools including Centreville Elementary School, Kennard Elementary School, and Centreville Middle School.
Ownership History
Date
Name
Owned For
Owner Type
Purchase Details
Closed on
Oct 5, 2005
Sold by
Rolfes Jaclyn A
Bought by
Kline Vincent and Kline Jaclyn A
Current Estimated Value
Home Financials for this Owner
Home Financials are based on the most recent Mortgage that was taken out on this home.
Original Mortgage
$249,000
Outstanding Balance
$133,696
Interest Rate
5.81%
Mortgage Type
New Conventional
Estimated Equity
$260,930
Purchase Details
Closed on
Aug 17, 2004
Sold by
Harned Bradley A and Karyn A, T
Bought by
Rolfes Jaclyn A
Purchase Details
Closed on
Dec 12, 2002
Sold by
Vinyard John K and Vinyard Kimberly A
Bought by
Harned Bradley A and Harned Karyn A
Purchase Details
Closed on
Apr 3, 1998
Sold by
Vinyard John K and Vinyard Kimberly A
Bought by
Vinyard John K and Vinyard Kimberly A
Purchase Details
Closed on
Jul 14, 1997
Sold by
Little Hut Partnership
Bought by
Vinyard John K and Vinyard Kimberly A
Create a Home Valuation Report for This Property
The Home Valuation Report is an in-depth analysis detailing your home's value as well as a comparison with similar homes in the area
Home Values in the Area
Average Home Value in this Area
Purchase History
| Date | Buyer | Sale Price | Title Company |
|---|---|---|---|
| Kline Vincent | -- | -- | |
| Rolfes Jaclyn A | $235,000 | -- | |
| Harned Bradley A | $180,000 | -- | |
| Vinyard John K | -- | -- | |
| Vinyard John K | $124,000 | -- |
Source: Public Records
Mortgage History
| Date | Status | Borrower | Loan Amount |
|---|---|---|---|
| Open | Kline Vincent | $249,000 | |
| Closed | Vinyard John K | -- |
Source: Public Records
Tax History Compared to Growth
Tax History
| Year | Tax Paid | Tax Assessment Tax Assessment Total Assessment is a certain percentage of the fair market value that is determined by local assessors to be the total taxable value of land and additions on the property. | Land | Improvement |
|---|---|---|---|---|
| 2025 | $2,670 | $288,100 | $90,200 | $197,900 |
| 2024 | $2,543 | $271,433 | $0 | $0 |
| 2023 | $2,420 | $254,767 | $0 | $0 |
| 2022 | $2,303 | $238,100 | $80,200 | $157,900 |
| 2021 | $2,323 | $237,000 | $0 | $0 |
| 2020 | $2,323 | $235,900 | $0 | $0 |
| 2019 | $2,312 | $234,800 | $80,200 | $154,600 |
| 2018 | $2,245 | $227,833 | $0 | $0 |
| 2017 | $2,178 | $220,867 | $0 | $0 |
| 2016 | -- | $213,900 | $0 | $0 |
| 2015 | $1,079 | $213,900 | $0 | $0 |
| 2014 | $1,079 | $213,900 | $0 | $0 |
Source: Public Records
Map
Nearby Homes
- 104 Gadd Dr
- 408 Laurens Way
- 0 5 281 Acres Schulyer Rd
- 113 Paulowina Rd
- 129 Thicket Ct
- 107 Thicket Ct
- 219 Songbird Ln
- 25548 Hill Rd
- 25513 Hill Rd
- 0 Trunk Line Rd Unit MDCM2005918
- 13364 River Rd
- 15551 Wharton Rd
- 112 Echo Ln
- 231 Ingleside Rd
- 115 Maple Ave
- 217 Austin Ct
- 113 Maple Ave
- 707 W Sunset Ave
- 14990 Greensboro Rd
- 229 Oldtown Rd
- 418 Denwood Ave
- 408 Denwood Ave
- 422 Denwood Ave
- 404 Denwood Ave
- Denwood Unit LOT 12
- 409 Denwood Ave
- 426 Denwood Ave
- 415 Denwood Ave
- 421 Denwood Ave
- 321 Malcolm Dr
- 425 Denwood Ave
- 403 Denwood Ave
- 400 Denwood Ave
- 109 Gadd Dr
- 113 Gadd Dr
- 318 Malcolm Dr
- 117 Gadd Dr
- 105 Gadd Dr
- 3205 Ruthsburg Rd
- 314 Malcolm Dr