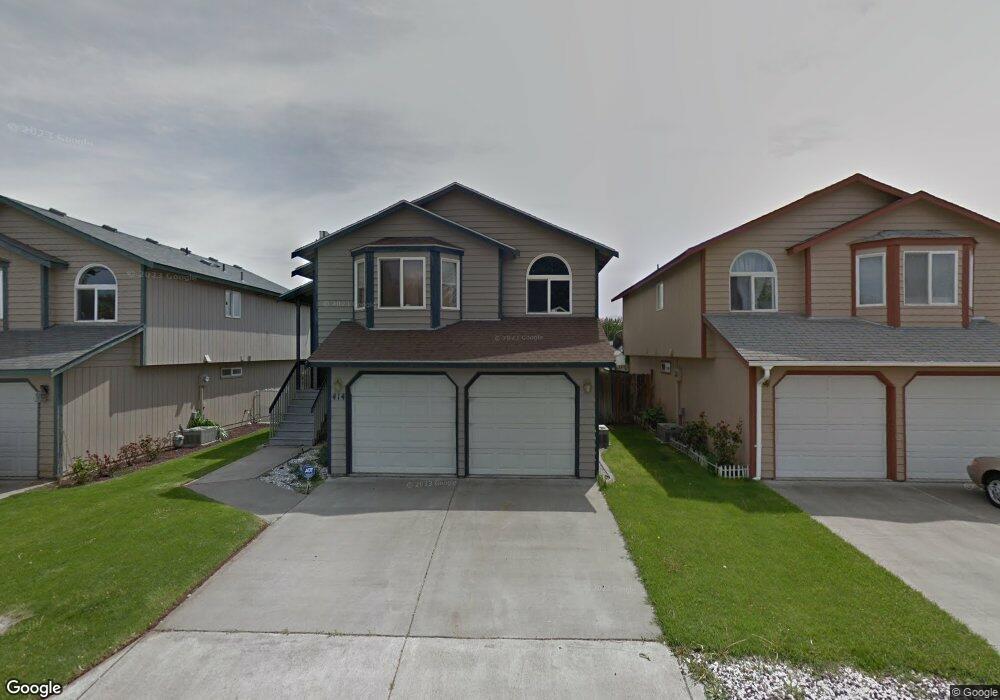
414 E 9th Place Unit HUD Home Kennewick, WA 99336
Estimated Value: $298,000 - $327,328
3
Beds
2
Baths
1,562
Sq Ft
$200/Sq Ft
Est. Value
About This Home
This home is located at 414 E 9th Place Unit HUD Home, Kennewick, WA 99336 and is currently estimated at $312,582, approximately $200 per square foot. 414 E 9th Place Unit HUD Home is a home located in Benton County with nearby schools including Eastgate Elementary School, Park Middle School, and Kennewick High School.
Ownership History
Date
Name
Owned For
Owner Type
Purchase Details
Closed on
Jun 5, 2017
Sold by
Moore Eric and Moore Sheila
Bought by
Ramos Diana
Current Estimated Value
Home Financials for this Owner
Home Financials are based on the most recent Mortgage that was taken out on this home.
Original Mortgage
$6,401
Outstanding Balance
$5,329
Interest Rate
4.05%
Mortgage Type
Stand Alone Second
Estimated Equity
$307,253
Purchase Details
Closed on
Oct 4, 2013
Sold by
Jpmorgan Chase Bank National Association
Bought by
The Secretary Of Housing & Urban Develop
Purchase Details
Closed on
Aug 13, 2013
Sold by
Robins Sharon E
Bought by
Jpmorgan Chase Bank National Association
Purchase Details
Closed on
Mar 5, 2009
Sold by
Esters Rhiannon and Esters Marquette
Bought by
Robins Sharon
Home Financials for this Owner
Home Financials are based on the most recent Mortgage that was taken out on this home.
Original Mortgage
$104,376
Interest Rate
5.08%
Mortgage Type
FHA
Create a Home Valuation Report for This Property
The Home Valuation Report is an in-depth analysis detailing your home's value as well as a comparison with similar homes in the area
Home Values in the Area
Average Home Value in this Area
Purchase History
| Date | Buyer | Sale Price | Title Company |
|---|---|---|---|
| Ramos Diana | $163,000 | Tri City Title & Escrow Llc | |
| The Secretary Of Housing & Urban Develop | -- | None Available | |
| Jpmorgan Chase Bank National Association | $93,450 | None Available | |
| Robins Sharon | $110,000 | Chicago Title |
Source: Public Records
Mortgage History
| Date | Status | Borrower | Loan Amount |
|---|---|---|---|
| Open | Ramos Diana | $6,401 | |
| Previous Owner | Robins Sharon | $104,376 |
Source: Public Records
Tax History Compared to Growth
Tax History
| Year | Tax Paid | Tax Assessment Tax Assessment Total Assessment is a certain percentage of the fair market value that is determined by local assessors to be the total taxable value of land and additions on the property. | Land | Improvement |
|---|---|---|---|---|
| 2024 | $2,526 | $287,600 | $52,500 | $235,100 |
| 2023 | $2,526 | $278,900 | $52,500 | $226,400 |
| 2022 | $2,093 | $226,650 | $52,500 | $174,150 |
| 2021 | $1,980 | $186,840 | $34,000 | $152,840 |
| 2020 | $1,987 | $171,540 | $18,700 | $152,840 |
| 2019 | $1,831 | $166,440 | $18,700 | $147,740 |
| 2018 | $1,731 | $156,250 | $18,700 | $137,550 |
| 2017 | $1,615 | $120,590 | $18,700 | $101,890 |
| 2016 | -- | $120,590 | $18,700 | $101,890 |
| 2015 | $1,497 | $109,790 | $22,000 | $87,790 |
| 2014 | -- | $109,790 | $22,000 | $87,790 |
| 2013 | -- | $109,790 | $22,000 | $87,790 |
Source: Public Records
Map
Nearby Homes
- 415 E 8th Ave
- 2731 S Alder St
- 2707 S Alder St
- 719 S Gum St
- 205 E 15th Ave
- 451 E 15th Place
- 210 E 5th Ave
- 721 E 15th Ave
- 818 S Juniper St
- 811 E 4th Ave
- 408 S Gum St
- 325 W 11th Ave
- 309 E 2nd Ave
- 2167 S Elm Place
- 412 W 11th Ave
- 1401 E 6th Ave
- 114 S Alder St
- 1203 S Garfield St
- 626 S Everett St
- 316 W 21st Ave
- 414 E 9th Place Unit Adorable Kennewick H
- 414 E 9th Place
- 408 E 9th Place
- 420 E 9th Place
- 426 E 9th Place
- 402 E 9th Place
- 415 E 9th Place
- 421 E 9th Place
- 432 E 9th Place
- 409 E 9th Place
- 427 E 9th Place
- 500 E 9th Place
- 433 E 9th Place
- 312 E 9th Place
- 501 E 9th Place
- 506 E 9th Place
- 912 S Date St
- 906 S Date St
- 306 E 9th Place
- 507 E 9th Place