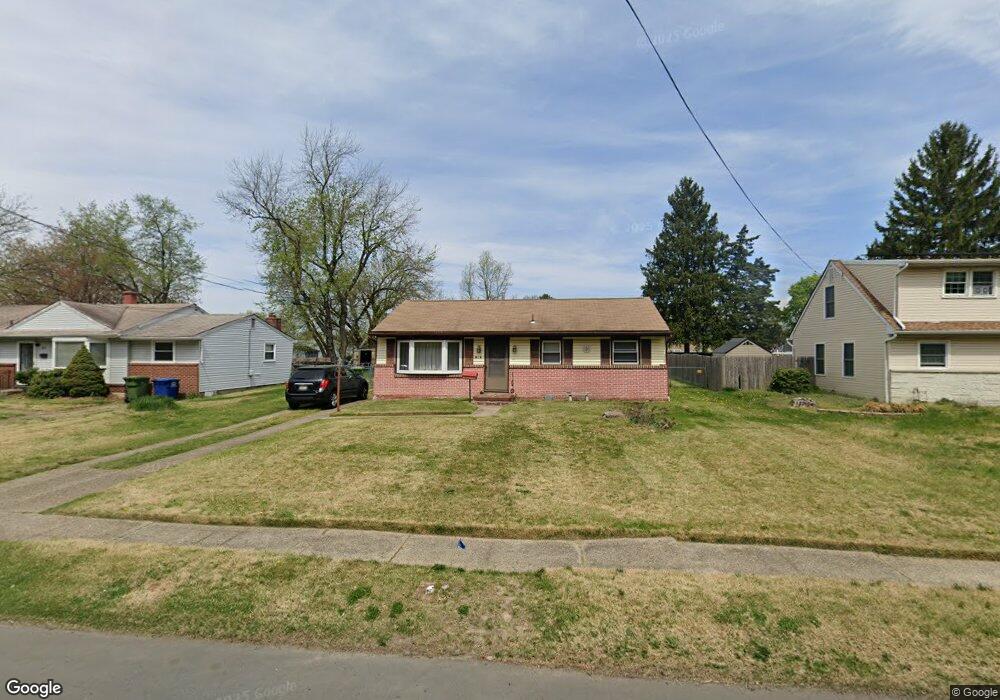
414 E Main St Marlton, NJ 08053
Estimated Value: $280,000 - $381,000
Studio
--
Bath
988
Sq Ft
$346/Sq Ft
Est. Value
About This Home
This home is located at 414 E Main St, Marlton, NJ 08053 and is currently estimated at $342,097, approximately $346 per square foot. 414 E Main St is a home located in Burlington County with nearby schools including H.L. Beeler Elementary School, Marlton Middle School, and Cherokee High School.
Ownership History
Date
Name
Owned For
Owner Type
Purchase Details
Closed on
Apr 18, 2002
Sold by
Mulholland James R and Mulholland Lilian
Bought by
Haines Sherry
Current Estimated Value
Home Financials for this Owner
Home Financials are based on the most recent Mortgage that was taken out on this home.
Original Mortgage
$94,242
Outstanding Balance
$40,098
Interest Rate
7.18%
Mortgage Type
FHA
Estimated Equity
$301,999
Create a Home Valuation Report for This Property
The Home Valuation Report is an in-depth analysis detailing your home's value as well as a comparison with similar homes in the area
Home Values in the Area
Average Home Value in this Area
Purchase History
| Date | Buyer | Sale Price | Title Company |
|---|---|---|---|
| Haines Sherry | $95,000 | -- |
Source: Public Records
Mortgage History
| Date | Status | Borrower | Loan Amount |
|---|---|---|---|
| Open | Haines Sherry | $94,242 |
Source: Public Records
Tax History
| Year | Tax Paid | Tax Assessment Tax Assessment Total Assessment is a certain percentage of the fair market value that is determined by local assessors to be the total taxable value of land and additions on the property. | Land | Improvement |
|---|---|---|---|---|
| 2025 | $6,154 | $180,200 | $115,000 | $65,200 |
| 2024 | $5,790 | $180,200 | $115,000 | $65,200 |
| 2023 | $5,790 | $180,200 | $115,000 | $65,200 |
| 2022 | $5,530 | $180,200 | $115,000 | $65,200 |
| 2021 | $5,134 | $180,200 | $115,000 | $65,200 |
| 2020 | $5,330 | $180,200 | $115,000 | $65,200 |
| 2019 | $5,287 | $180,200 | $115,000 | $65,200 |
| 2018 | $5,213 | $180,200 | $115,000 | $65,200 |
| 2017 | $5,152 | $180,200 | $115,000 | $65,200 |
| 2016 | $5,026 | $180,200 | $115,000 | $65,200 |
| 2015 | $4,937 | $180,200 | $115,000 | $65,200 |
| 2014 | $4,797 | $180,200 | $115,000 | $65,200 |
Source: Public Records
Map
Nearby Homes
- 1 Boswell Rd
- 41 Radnor Blvd
- 11 Heritage Rd
- 3 Kennington Rd
- 29 Marlborough Ave
- 8 Dominion Dr
- 3 Douglas Terrace
- 17 Erindale Dr
- 150 S Elmwood Rd
- 42 Hornsby Dr
- 8 Greenbrook Dr
- 76 Kent Ave
- 20 Longhurst Rd
- 6 Kingsley Ave
- 13 Tory Ln
- 1315 Marlton Pike
- 139 Ramsey Ave
- 44 Greenbrook Dr
- 61 S Maple Ave
- 30 Cooper Ave
Your Personal Tour Guide
Ask me questions while you tour the home.