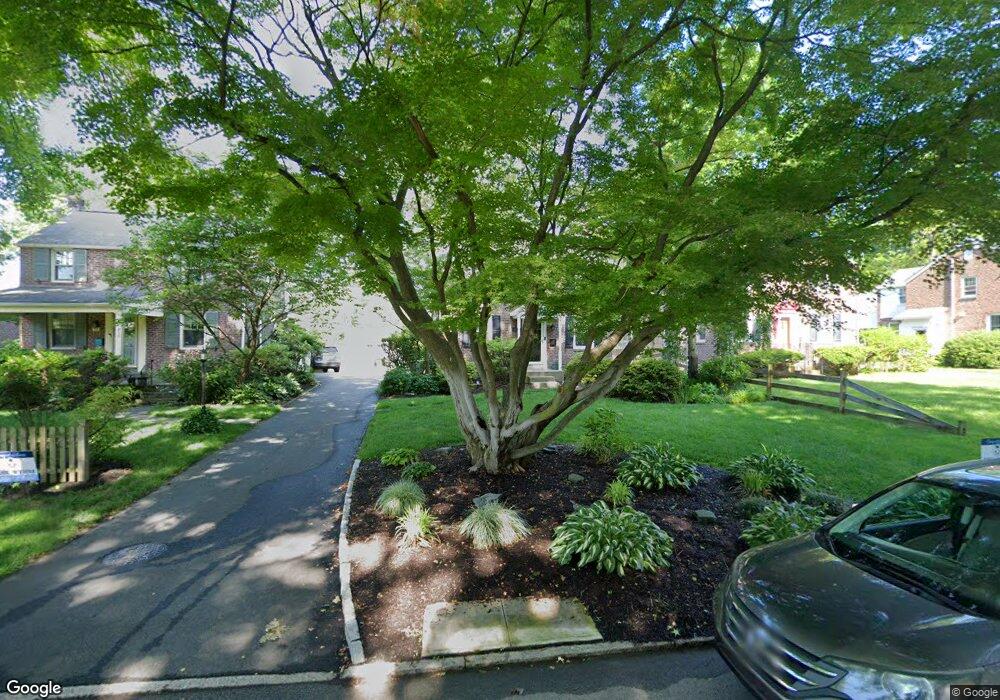
414 E Spring Ave Ardmore, PA 19003
Estimated Value: $553,000 - $762,000
3
Beds
1
Bath
1,554
Sq Ft
$400/Sq Ft
Est. Value
About This Home
This home is located at 414 E Spring Ave, Ardmore, PA 19003 and is currently estimated at $621,028, approximately $399 per square foot. 414 E Spring Ave is a home located in Montgomery County with nearby schools including Penn Wynne Elementary School, Bala-Cynwyd Middle School, and Lower Merion High School.
Ownership History
Date
Name
Owned For
Owner Type
Purchase Details
Closed on
Apr 24, 2012
Sold by
Mcnamara Erin C and Van Winkle Timothy R
Bought by
Vanwinkle Timothy R and Van Winkle Erin C
Current Estimated Value
Home Financials for this Owner
Home Financials are based on the most recent Mortgage that was taken out on this home.
Original Mortgage
$366,300
Outstanding Balance
$254,079
Interest Rate
4%
Estimated Equity
$366,949
Purchase Details
Closed on
Sep 5, 2006
Sold by
Quinter Joshua C and Quinter Patricia
Bought by
Mcnamara Erin C and Vanwinkle Timothy R
Home Financials for this Owner
Home Financials are based on the most recent Mortgage that was taken out on this home.
Original Mortgage
$334,000
Interest Rate
6.59%
Purchase Details
Closed on
Aug 28, 1998
Sold by
Braithwaite Hugh and Braithwaite Carolyn
Bought by
Lamb Michael P and Lamb Emily D
Create a Home Valuation Report for This Property
The Home Valuation Report is an in-depth analysis detailing your home's value as well as a comparison with similar homes in the area
Home Values in the Area
Average Home Value in this Area
Purchase History
| Date | Buyer | Sale Price | Title Company |
|---|---|---|---|
| Vanwinkle Timothy R | -- | None Available | |
| Mcnamara Erin C | $417,500 | None Available | |
| Lamb Michael P | $208,000 | -- |
Source: Public Records
Mortgage History
| Date | Status | Borrower | Loan Amount |
|---|---|---|---|
| Open | Vanwinkle Timothy R | $366,300 | |
| Closed | Mcnamara Erin C | $334,000 |
Source: Public Records
Tax History
| Year | Tax Paid | Tax Assessment Tax Assessment Total Assessment is a certain percentage of the fair market value that is determined by local assessors to be the total taxable value of land and additions on the property. | Land | Improvement |
|---|---|---|---|---|
| 2025 | $7,039 | $168,560 | $59,830 | $108,730 |
| 2024 | $7,039 | $168,560 | $59,830 | $108,730 |
| 2023 | $6,746 | $168,560 | $59,830 | $108,730 |
| 2022 | $6,621 | $168,560 | $59,830 | $108,730 |
| 2021 | $6,470 | $168,560 | $59,830 | $108,730 |
| 2020 | $6,312 | $168,560 | $59,830 | $108,730 |
| 2019 | $6,201 | $168,560 | $59,830 | $108,730 |
Source: Public Records
Map
Nearby Homes
- 1525 W Wynnewood Rd
- 2432 Olcott Ave
- 124 Grandview Rd
- 116 Grandview Rd
- 1522 Knox Rd
- 724 Loraine St
- 132 Linwood Ave
- 142 Arnold Rd
- 612 Argyle Cir
- 754 Oak View Rd
- 761 Hathaway Ln
- 2757 Saint Marys Rd
- 145 Walnut Ave
- 140 Walnut Ave
- 222 Lippincott Ave
- 2471 Wynnefield Dr
- 633 Georges Ln
- 1628 Surrey Ln
- 818 Clifford Ave
- 601 Georges Ln
- 416 E Spring Ave
- 412 E Spring Ave
- 418 E Spring Ave
- 408 E Spring Ave
- 420 E Spring Ave
- 1512 Wynnewood Rd
- 1512 Wynnewood Rd
- 1508 Wynnewood Rd
- 1514 Wynnewood Rd
- 1504 Wynnewood Rd
- 422 E Spring Ave
- 2317 E County Line Rd
- 1518 Wynnewood Rd
- 1500 Wynnewood Rd
- 1437 Sussex Rd
- 424 E Spring Ave
- 2313 E County Line Rd
- 1518 W Wynnewood Rd
- 2309 E County Line Rd
- 2321 E County Line Rd
Your Personal Tour Guide
Ask me questions while you tour the home.