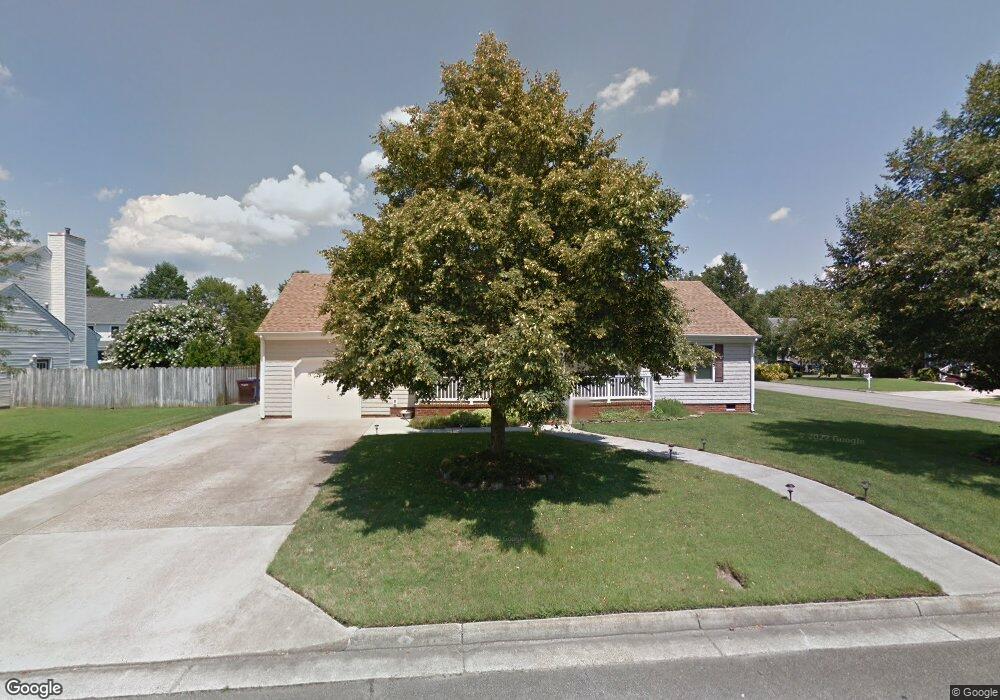
414 Flintlock Rd Chesapeake, VA 23322
Great Bridge NeighborhoodEstimated Value: $531,000 - $542,000
4
Beds
3
Baths
2,364
Sq Ft
$227/Sq Ft
Est. Value
About This Home
This home is located at 414 Flintlock Rd, Chesapeake, VA 23322 and is currently estimated at $536,944, approximately $227 per square foot. 414 Flintlock Rd is a home located in Chesapeake City with nearby schools including Great Bridge Primary School, Great Bridge Intermediate School, and Great Bridge Middle School.
Ownership History
Date
Name
Owned For
Owner Type
Purchase Details
Closed on
Jul 12, 2021
Sold by
Parkerton Ronald R and Chou-Parkerton Te-Lein Esther
Bought by
San Angelo David and San Angelo Adrienne
Current Estimated Value
Home Financials for this Owner
Home Financials are based on the most recent Mortgage that was taken out on this home.
Original Mortgage
$424,545
Outstanding Balance
$385,209
Interest Rate
2.9%
Mortgage Type
VA
Estimated Equity
$151,735
Purchase Details
Closed on
Jul 24, 2013
Sold by
Jordan Henry G
Bought by
Parkerton Ronald R
Home Financials for this Owner
Home Financials are based on the most recent Mortgage that was taken out on this home.
Original Mortgage
$342,100
Interest Rate
3.95%
Mortgage Type
VA
Purchase Details
Closed on
Mar 2, 2009
Sold by
Ellison Eugene M
Bought by
Jordan Henry G
Home Financials for this Owner
Home Financials are based on the most recent Mortgage that was taken out on this home.
Original Mortgage
$224,000
Interest Rate
4.93%
Mortgage Type
New Conventional
Create a Home Valuation Report for This Property
The Home Valuation Report is an in-depth analysis detailing your home's value as well as a comparison with similar homes in the area
Home Values in the Area
Average Home Value in this Area
Purchase History
| Date | Buyer | Sale Price | Title Company |
|---|---|---|---|
| San Angelo David | $415,000 | Select Settlement Group Inc | |
| Parkerton Ronald R | $334,900 | -- | |
| Jordan Henry G | $280,000 | -- |
Source: Public Records
Mortgage History
| Date | Status | Borrower | Loan Amount |
|---|---|---|---|
| Open | San Angelo David | $424,545 | |
| Previous Owner | Parkerton Ronald R | $342,100 | |
| Previous Owner | Jordan Henry G | $224,000 |
Source: Public Records
Tax History
| Year | Tax Paid | Tax Assessment Tax Assessment Total Assessment is a certain percentage of the fair market value that is determined by local assessors to be the total taxable value of land and additions on the property. | Land | Improvement |
|---|---|---|---|---|
| 2025 | $4,609 | $483,100 | $190,000 | $293,100 |
| 2024 | $4,609 | $456,300 | $180,000 | $276,300 |
| 2023 | $4,105 | $431,900 | $170,000 | $261,900 |
| 2022 | $4,133 | $409,200 | $150,000 | $259,200 |
| 2021 | $2,905 | $361,300 | $130,000 | $231,300 |
| 2020 | $3,556 | $338,700 | $125,000 | $213,700 |
| 2019 | $3,471 | $330,600 | $120,000 | $210,600 |
| 2018 | $3,287 | $313,100 | $120,000 | $193,100 |
| 2017 | $3,308 | $315,000 | $120,000 | $195,000 |
| 2016 | $3,157 | $300,700 | $115,000 | $185,700 |
| 2015 | $2,342 | $297,400 | $115,000 | $182,400 |
| 2014 | $3,069 | $292,300 | $115,000 | $177,300 |
Source: Public Records
Map
Nearby Homes
- 621 Wickwood Dr
- 509 Hanbury Rd W
- 304 Spurlane Cir
- 528 Wickwood Dr
- 544 Greenway Dr
- 720 Dickens Place
- 301 Woodbridge Dr
- 613 Royal Grant Dr
- 408 Mike Trail
- 225 Vanette Dr
- 436 Mike Trail
- 605 Resh Ct
- 316 S Hill Ln
- 337 Willard Dr
- 415 S Hill Ln
- 900 Jennings Ln
- 902 Jennings Ln
- 904 Jennings Ln
- 906 Jennings Ln
- 204 Traditions Way
- 0 Flintlock Rd
- 416 Flintlock Rd
- 763 Remington Dr
- 766 Remington Dr
- 413 Flintlock Rd
- 420 Flintlock Rd
- 807 Stardale Cir
- 801 Union Forge Ln
- 762 Remington Dr
- 727 Stardale Dr
- 412 Flintlock Rd
- 725 Stardale Dr
- 411 Flintlock Rd
- 804 Stardale Cir
- 424 Flintlock Rd
- 801 Stardale Dr
- 800 Union Forge Ln
- 410 Flintlock Rd
- 409 Flintlock Rd
- 800 Stardale Cir
Your Personal Tour Guide
Ask me questions while you tour the home.