Estimated Value: $52,000 - $80,000
2
Beds
1
Bath
948
Sq Ft
$68/Sq Ft
Est. Value
About This Home
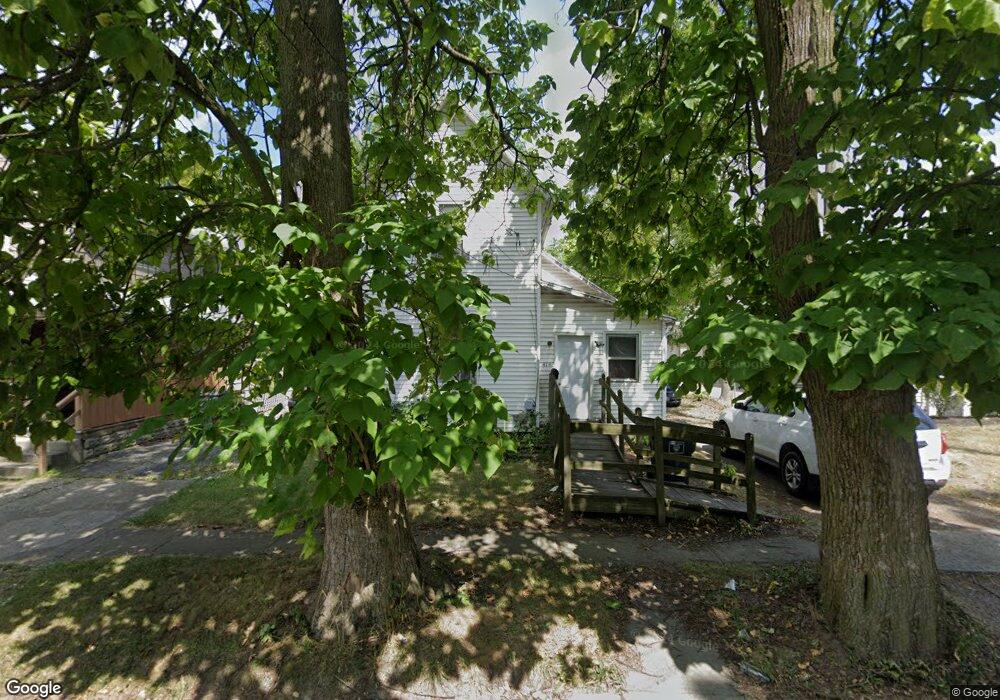
This home is located at 414 Haller St, Lima, OH 45801 and is currently estimated at $64,872, approximately $68 per square foot. 414 Haller St is a home located in Allen County with nearby schools including Independence Elementary School, Lima North Middle School, and Lima West Middle School.
Ownership History
Date
Name
Owned For
Owner Type
Purchase Details
Closed on
Aug 2, 2021
Sold by
Caj Rentals Ltd
Bought by
Lima 315 Llc
Current Estimated Value
Home Financials for this Owner
Home Financials are based on the most recent Mortgage that was taken out on this home.
Original Mortgage
$612,314
Outstanding Balance
$556,783
Interest Rate
2.9%
Mortgage Type
Commercial
Estimated Equity
-$491,911
Purchase Details
Closed on
Sep 18, 2000
Sold by
Lima Properties Ltd
Bought by
Caj Rentals Ltd
Home Financials for this Owner
Home Financials are based on the most recent Mortgage that was taken out on this home.
Original Mortgage
$15,686
Interest Rate
8.14%
Mortgage Type
New Conventional
Purchase Details
Closed on
Dec 31, 1997
Sold by
Lima Land Co
Bought by
Lima Properties
Purchase Details
Closed on
Sep 16, 1993
Sold by
Fought Dinnie E
Bought by
Dickason Oren E
Purchase Details
Closed on
Jan 1, 1990
Bought by
Fought Dinnie E
Create a Home Valuation Report for This Property
The Home Valuation Report is an in-depth analysis detailing your home's value as well as a comparison with similar homes in the area
Purchase History
| Date | Buyer | Sale Price | Title Company |
|---|---|---|---|
| Lima 315 Llc | $294,400 | None Available | |
| Lima 315 Llc | $883 | None Listed On Document | |
| Caj Rentals Ltd | $15,214 | -- | |
| Lima Properties | $57,200 | -- | |
| Dickason Oren E | $10,000 | -- | |
| Fought Dinnie E | -- | -- |
Source: Public Records
Mortgage History
| Date | Status | Borrower | Loan Amount |
|---|---|---|---|
| Open | Lima 315 Llc | $612,314 | |
| Closed | Lima 315 Llc | $612,314 | |
| Closed | Lima 315 Llc | $287,685 | |
| Previous Owner | Caj Rentals Ltd | $15,686 |
Source: Public Records
Tax History
| Year | Tax Paid | Tax Assessment Tax Assessment Total Assessment is a certain percentage of the fair market value that is determined by local assessors to be the total taxable value of land and additions on the property. | Land | Improvement |
|---|---|---|---|---|
| 2024 | $542 | $13,550 | $2,240 | $11,310 |
| 2023 | $493 | $10,640 | $1,750 | $8,890 |
| 2022 | $494 | $10,640 | $1,750 | $8,890 |
| 2021 | $522 | $10,640 | $1,750 | $8,890 |
| 2020 | $494 | $8,860 | $1,680 | $7,180 |
| 2019 | $494 | $8,860 | $1,680 | $7,180 |
| 2018 | $492 | $8,860 | $1,680 | $7,180 |
| 2017 | $495 | $8,860 | $1,680 | $7,180 |
| 2016 | $503 | $8,860 | $1,680 | $7,180 |
| 2015 | $451 | $8,860 | $1,680 | $7,180 |
| 2014 | $451 | $7,710 | $1,650 | $6,060 |
| 2013 | $440 | $7,710 | $1,650 | $6,060 |
Source: Public Records
Map
Nearby Homes
- 416 Hazel Ave
- 435 Marian Ave
- 5 Unit Package
- 555 Haller St
- 627 Brice Ave
- 431 N Metcalf St
- 745 Richie Ave
- 934 N Metcalf St
- 816 N Baxter St
- 735 Brice Ave
- 406 Ewing Ave
- 325 N McDonel St
- 316 Ewing Ave
- 841 N Baxter St
- 735 N Elizabeth St
- 631 Hazel Ave
- 753 Brice Ave
- 774 W Wayne St
- 703 N Collett St
- 508 N Collett St
Your Personal Tour Guide
Ask me questions while you tour the home.