Estimated Value: $58,000 - $122,000
3
Beds
1
Bath
1,040
Sq Ft
$87/Sq Ft
Est. Value
About This Home
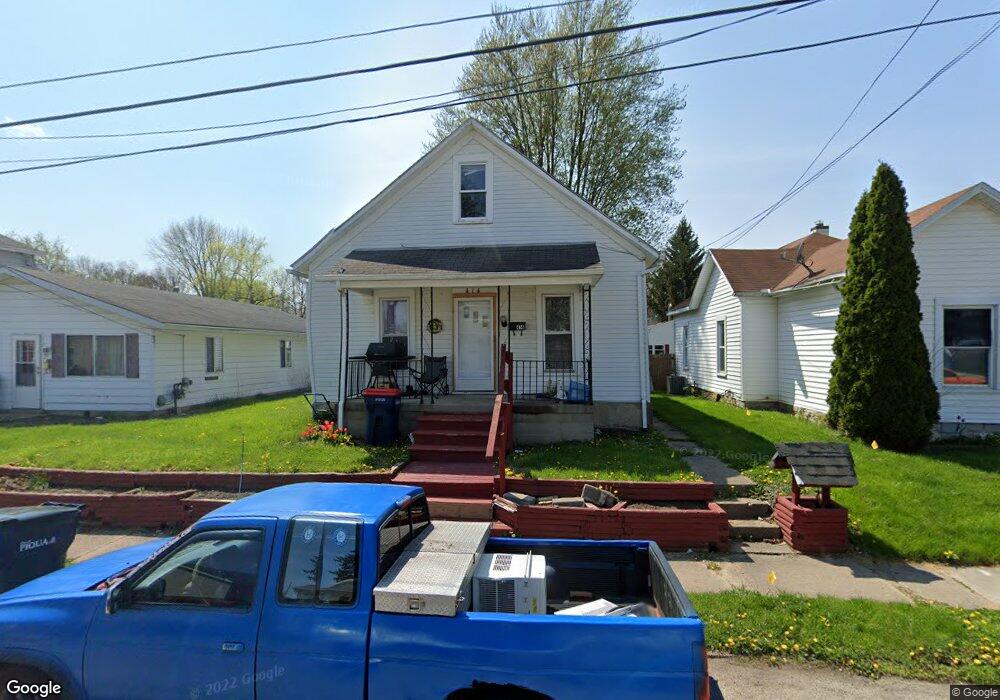
This home is located at 414 Kitt St, Piqua, OH 45356 and is currently estimated at $90,898, approximately $87 per square foot. 414 Kitt St is a home located in Miami County with nearby schools including Piqua Junior High School, Piqua High School, and Nicholas School.
Ownership History
Date
Name
Owned For
Owner Type
Purchase Details
Closed on
Jul 15, 2010
Sold by
Federal Home Loan Mortgage Corporation
Bought by
Liette Douglas and Liette Edwin
Current Estimated Value
Purchase Details
Closed on
Mar 16, 2010
Sold by
Thompson Darrin L
Bought by
Federal Home Loan Mortgage Corp
Purchase Details
Closed on
Jul 3, 2001
Sold by
Thompson Darren L
Bought by
Everette Joseph A
Purchase Details
Closed on
Aug 29, 1995
Sold by
Cummings Delbert L
Bought by
Thompson Darrin L
Home Financials for this Owner
Home Financials are based on the most recent Mortgage that was taken out on this home.
Original Mortgage
$49,200
Interest Rate
7.43%
Mortgage Type
New Conventional
Create a Home Valuation Report for This Property
The Home Valuation Report is an in-depth analysis detailing your home's value as well as a comparison with similar homes in the area
Home Values in the Area
Average Home Value in this Area
Purchase History
| Date | Buyer | Sale Price | Title Company |
|---|---|---|---|
| Liette Douglas | $15,400 | -- | |
| Federal Home Loan Mortgage Corp | $36,000 | -- | |
| Everette Joseph A | $57,782 | -- | |
| Thompson Darrin L | $48,000 | -- |
Source: Public Records
Mortgage History
| Date | Status | Borrower | Loan Amount |
|---|---|---|---|
| Previous Owner | Thompson Darrin L | $49,200 |
Source: Public Records
Tax History Compared to Growth
Tax History
| Year | Tax Paid | Tax Assessment Tax Assessment Total Assessment is a certain percentage of the fair market value that is determined by local assessors to be the total taxable value of land and additions on the property. | Land | Improvement |
|---|---|---|---|---|
| 2024 | $577 | $13,690 | $6,230 | $7,460 |
| 2023 | $577 | $13,690 | $6,230 | $7,460 |
| 2022 | $587 | $13,690 | $6,230 | $7,460 |
| 2021 | $475 | $10,150 | $4,620 | $5,530 |
| 2020 | $467 | $10,150 | $4,620 | $5,530 |
| 2019 | $469 | $10,150 | $4,620 | $5,530 |
| 2018 | $459 | $9,460 | $4,660 | $4,800 |
| 2017 | $464 | $9,460 | $4,660 | $4,800 |
| 2016 | $460 | $9,460 | $4,660 | $4,800 |
| 2015 | $452 | $9,100 | $4,480 | $4,620 |
| 2014 | $452 | $9,100 | $4,480 | $4,620 |
| 2013 | $454 | $9,100 | $4,480 | $4,620 |
Source: Public Records
Map
Nearby Homes