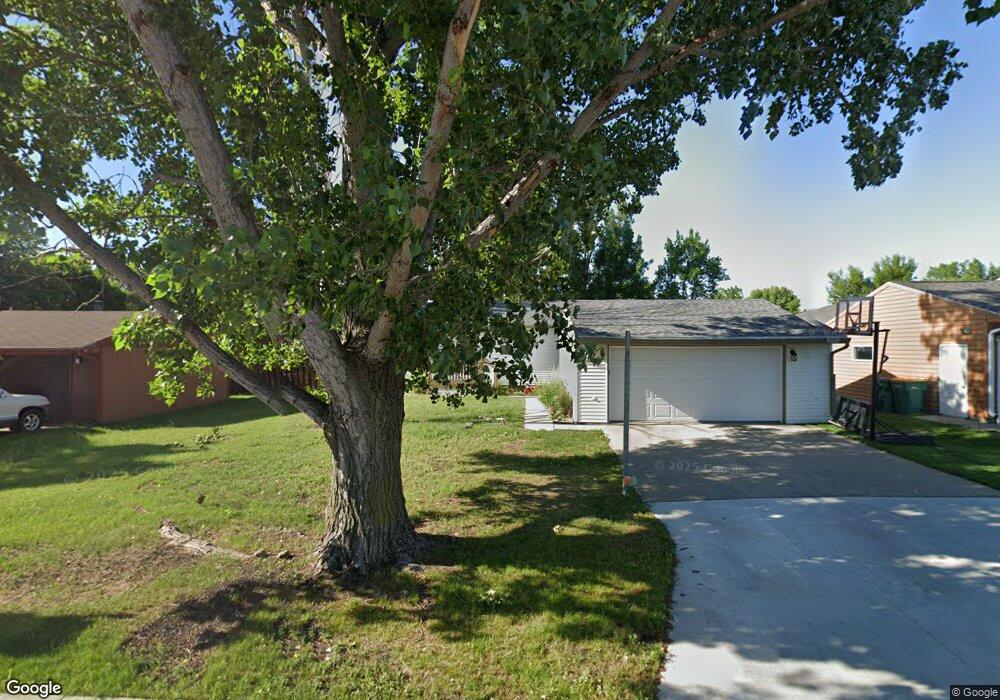
414 Maple Dr Mapleton, ND 58059
Estimated Value: $243,000 - $274,000
3
Beds
2
Baths
2,000
Sq Ft
$130/Sq Ft
Est. Value
About This Home
This home is located at 414 Maple Dr, Mapleton, ND 58059 and is currently estimated at $260,594, approximately $130 per square foot. 414 Maple Dr is a home located in Cass County with nearby schools including Mapleton Elementary School.
Ownership History
Date
Name
Owned For
Owner Type
Purchase Details
Closed on
Aug 19, 2016
Sold by
Vrchota Matthew K and Schaefer Vrchota Nicolette D
Bought by
Davidson Dallas W and Davidson Melissa B
Current Estimated Value
Home Financials for this Owner
Home Financials are based on the most recent Mortgage that was taken out on this home.
Original Mortgage
$171,000
Outstanding Balance
$136,306
Interest Rate
3.45%
Mortgage Type
New Conventional
Estimated Equity
$124,288
Purchase Details
Closed on
Oct 10, 2009
Sold by
Hoyhtya Kevin and Hoyhtya Erica
Bought by
Vrchota Matthew K and Schaefer Vrchota Nicolette D
Home Financials for this Owner
Home Financials are based on the most recent Mortgage that was taken out on this home.
Original Mortgage
$109,971
Interest Rate
5.4%
Mortgage Type
FHA
Purchase Details
Closed on
Sep 27, 2007
Sold by
Dean Stephen A and Dean Jodi L
Bought by
Hoyhtya Kevin and Hoyhtya Erica
Home Financials for this Owner
Home Financials are based on the most recent Mortgage that was taken out on this home.
Original Mortgage
$100,000
Interest Rate
6.66%
Mortgage Type
New Conventional
Create a Home Valuation Report for This Property
The Home Valuation Report is an in-depth analysis detailing your home's value as well as a comparison with similar homes in the area
Purchase History
| Date | Buyer | Sale Price | Title Company |
|---|---|---|---|
| Davidson Dallas W | $180,000 | None Available | |
| Vrchota Matthew K | $112,000 | -- | |
| Hoyhtya Kevin | -- | -- |
Source: Public Records
Mortgage History
| Date | Status | Borrower | Loan Amount |
|---|---|---|---|
| Open | Davidson Dallas W | $171,000 | |
| Previous Owner | Vrchota Matthew K | $109,971 | |
| Previous Owner | Hoyhtya Kevin | $100,000 |
Source: Public Records
Tax History
| Year | Tax Paid | Tax Assessment Tax Assessment Total Assessment is a certain percentage of the fair market value that is determined by local assessors to be the total taxable value of land and additions on the property. | Land | Improvement |
|---|---|---|---|---|
| 2024 | $2,558 | $106,200 | $18,350 | $87,850 |
| 2023 | $2,988 | $105,550 | $18,350 | $87,200 |
| 2022 | $2,572 | $97,000 | $18,350 | $78,650 |
| 2021 | $2,413 | $87,700 | $14,150 | $73,550 |
| 2020 | $2,313 | $85,950 | $14,150 | $71,800 |
| 2019 | $2,316 | $85,950 | $14,150 | $71,800 |
| 2018 | $2,344 | $85,950 | $14,150 | $71,800 |
| 2017 | $2,284 | $84,500 | $14,150 | $70,350 |
| 2016 | $1,369 | $64,500 | $6,900 | $57,600 |
| 2015 | $1,218 | $59,750 | $6,400 | $53,350 |
| 2014 | $1,195 | $54,300 | $5,800 | $48,500 |
| 2013 | $1,215 | $54,300 | $5,800 | $48,500 |
Source: Public Records
Map
Nearby Homes
Your Personal Tour Guide
Ask me questions while you tour the home.