Estimated Value: $52,000 - $140,000
2
Beds
2
Baths
1,450
Sq Ft
$66/Sq Ft
Est. Value
About This Home
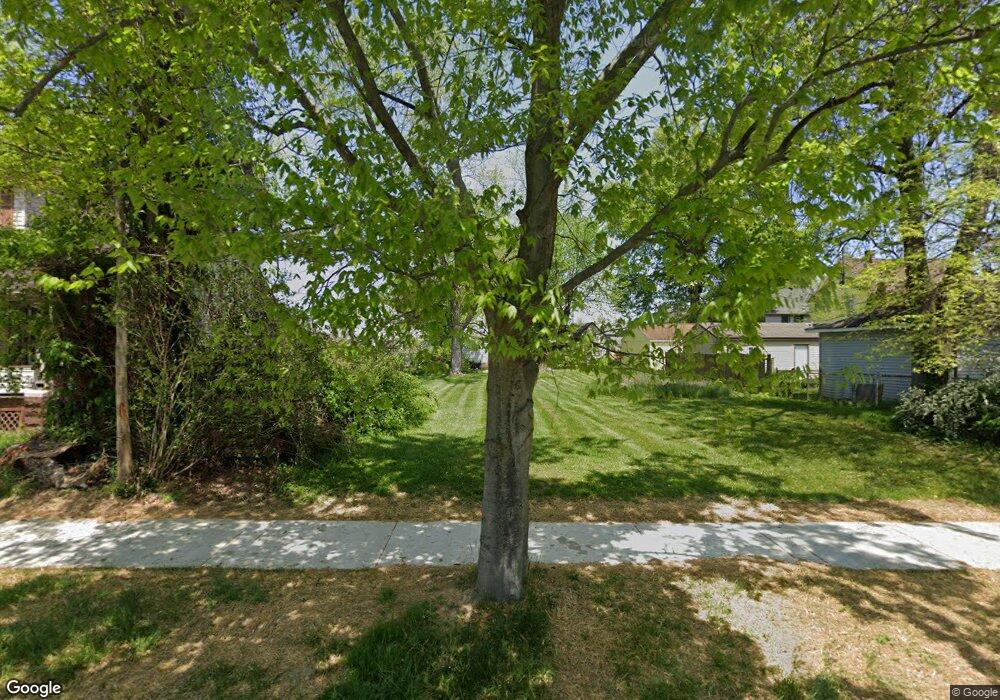
This home is located at 414 Maple St, Niles, OH 44446 and is currently estimated at $96,000, approximately $66 per square foot. 414 Maple St is a home located in Trumbull County with nearby schools including Niles Primary School, Niles Intermediate School, and Niles Middle School.
Ownership History
Date
Name
Owned For
Owner Type
Purchase Details
Closed on
Jul 24, 2017
Sold by
Johnstone Aaron Richard and Johnstone Amber
Bought by
Croutch Raymond Fredrick
Current Estimated Value
Home Financials for this Owner
Home Financials are based on the most recent Mortgage that was taken out on this home.
Original Mortgage
$57,931
Outstanding Balance
$49,226
Interest Rate
4.75%
Mortgage Type
FHA
Estimated Equity
$46,774
Purchase Details
Closed on
Jun 24, 2011
Sold by
Wells Fargo Bank Na
Bought by
Johnstone Aaron Richard
Purchase Details
Closed on
Apr 1, 2010
Sold by
Plesea Randy O
Bought by
Wells Fargo Bank Na
Purchase Details
Closed on
May 3, 2002
Sold by
Solida Rodney A and Solida Patricia L
Bought by
Plesea Randy O
Purchase Details
Closed on
Jan 1, 1990
Bought by
Rodney A Solida
Create a Home Valuation Report for This Property
The Home Valuation Report is an in-depth analysis detailing your home's value as well as a comparison with similar homes in the area
Home Values in the Area
Average Home Value in this Area
Purchase History
| Date | Buyer | Sale Price | Title Company |
|---|---|---|---|
| Croutch Raymond Fredrick | $59,000 | None Available | |
| Johnstone Aaron Richard | $23,000 | Servicelink | |
| Wells Fargo Bank Na | $30,000 | None Available | |
| Plesea Randy O | $74,000 | -- | |
| Rodney A Solida | -- | -- |
Source: Public Records
Mortgage History
| Date | Status | Borrower | Loan Amount |
|---|---|---|---|
| Open | Croutch Raymond Fredrick | $57,931 |
Source: Public Records
Tax History
| Year | Tax Paid | Tax Assessment Tax Assessment Total Assessment is a certain percentage of the fair market value that is determined by local assessors to be the total taxable value of land and additions on the property. | Land | Improvement |
|---|---|---|---|---|
| 2024 | $80 | $1,860 | $1,860 | $0 |
| 2023 | $80 | $1,860 | $1,860 | $0 |
| 2022 | $93 | $1,860 | $1,860 | $0 |
| 2021 | $98 | $1,860 | $1,860 | $0 |
| 2020 | $99 | $1,860 | $1,860 | $0 |
| 2019 | $104 | $1,860 | $1,860 | $0 |
| 2018 | $104 | $1,860 | $1,860 | $0 |
| 2017 | $103 | $1,860 | $1,860 | $0 |
| 2016 | $104 | $1,860 | $1,860 | $0 |
| 2015 | $103 | $1,860 | $1,860 | $0 |
| 2014 | $103 | $1,860 | $1,860 | $0 |
| 2013 | $98 | $1,860 | $1,860 | $0 |
Source: Public Records
Map
Nearby Homes
Your Personal Tour Guide
Ask me questions while you tour the home.