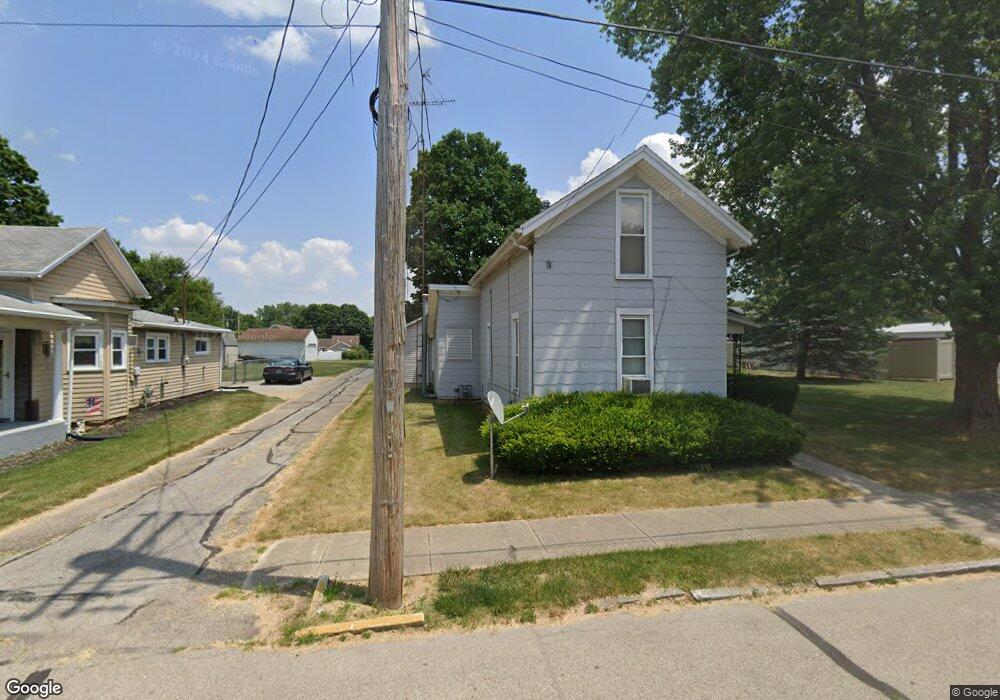
414 N Main St Covington, OH 45318
Estimated Value: $38,991 - $155,000
2
Beds
1
Bath
1,005
Sq Ft
$95/Sq Ft
Est. Value
About This Home
This home is located at 414 N Main St, Covington, OH 45318 and is currently estimated at $95,498, approximately $95 per square foot. 414 N Main St is a home located in Miami County with nearby schools including Covington Elementary/Junior High School, Covington Junior High School, and Covington High School.
Ownership History
Date
Name
Owned For
Owner Type
Purchase Details
Closed on
Jun 26, 2025
Sold by
Bundy Vesta Eileen and Bundy Anthony C
Bought by
Noffsinger Cheryl
Current Estimated Value
Home Financials for this Owner
Home Financials are based on the most recent Mortgage that was taken out on this home.
Original Mortgage
$38,000
Outstanding Balance
$37,803
Interest Rate
6.81%
Mortgage Type
New Conventional
Estimated Equity
$57,695
Purchase Details
Closed on
May 1, 1987
Sold by
Bundy Anthony C
Bought by
Anthony C Bundy
Create a Home Valuation Report for This Property
The Home Valuation Report is an in-depth analysis detailing your home's value as well as a comparison with similar homes in the area
Home Values in the Area
Average Home Value in this Area
Purchase History
| Date | Buyer | Sale Price | Title Company |
|---|---|---|---|
| Noffsinger Cheryl | $40,000 | None Listed On Document | |
| Anthony C Bundy | -- | -- |
Source: Public Records
Mortgage History
| Date | Status | Borrower | Loan Amount |
|---|---|---|---|
| Open | Noffsinger Cheryl | $38,000 |
Source: Public Records
Tax History
| Year | Tax Paid | Tax Assessment Tax Assessment Total Assessment is a certain percentage of the fair market value that is determined by local assessors to be the total taxable value of land and additions on the property. | Land | Improvement |
|---|---|---|---|---|
| 2025 | $1,497 | $44,800 | $12,600 | $32,200 |
| 2024 | $1,497 | $34,830 | $13,650 | $21,180 |
| 2023 | $1,334 | $34,830 | $13,650 | $21,180 |
| 2022 | $1,331 | $34,830 | $13,650 | $21,180 |
| 2021 | $1,104 | $26,780 | $10,500 | $16,280 |
| 2020 | $1,107 | $26,780 | $10,500 | $16,280 |
| 2019 | $1,112 | $26,780 | $10,500 | $16,280 |
| 2018 | $986 | $23,700 | $8,190 | $15,510 |
| 2017 | $1,004 | $23,700 | $8,190 | $15,510 |
| 2016 | $992 | $23,700 | $8,190 | $15,510 |
| 2015 | $915 | $22,790 | $7,880 | $14,910 |
| 2014 | $915 | $22,790 | $7,880 | $14,910 |
| 2013 | $883 | $22,790 | $7,880 | $14,910 |
Source: Public Records
Map
Nearby Homes
Your Personal Tour Guide
Ask me questions while you tour the home.