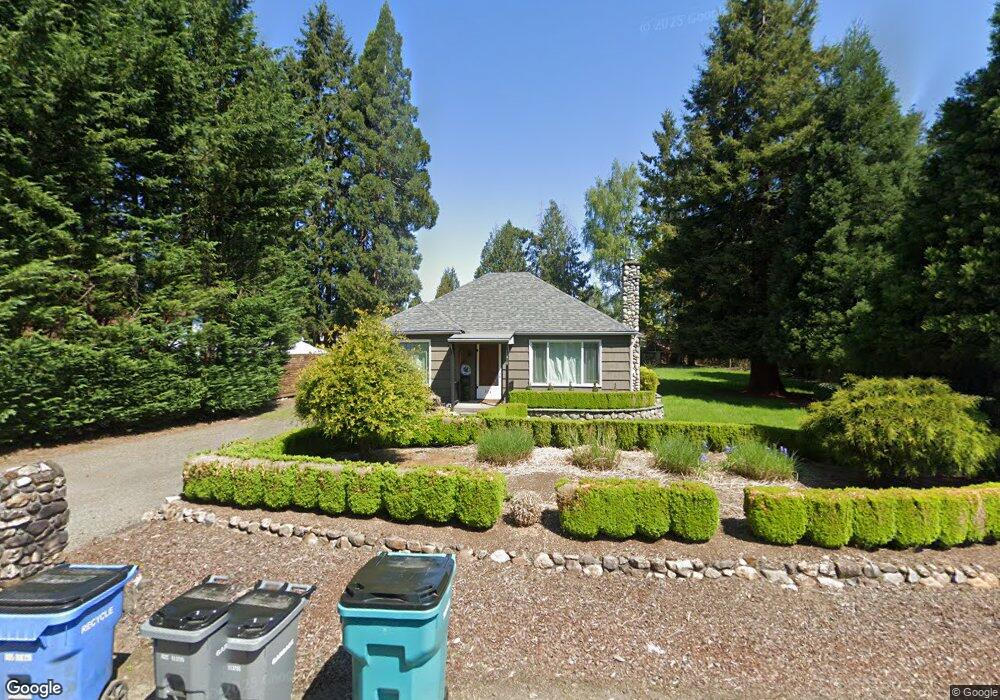
414 NE 6th St Battle Ground, WA 98604
Estimated Value: $475,000 - $547,176
3
Beds
2
Baths
1,797
Sq Ft
$280/Sq Ft
Est. Value
About This Home
This home is located at 414 NE 6th St, Battle Ground, WA 98604 and is currently estimated at $502,794, approximately $279 per square foot. 414 NE 6th St is a home located in Clark County with nearby schools including Captain Strong Primary School, Chief Umtuch Middle School, and Battle Ground High School.
Ownership History
Date
Name
Owned For
Owner Type
Purchase Details
Closed on
Aug 25, 2023
Sold by
Hendrickson Dale T and Hendrickson Jennifer L
Bought by
Tapani Jake and Tapani Sophia
Current Estimated Value
Home Financials for this Owner
Home Financials are based on the most recent Mortgage that was taken out on this home.
Original Mortgage
$387,000
Outstanding Balance
$378,559
Interest Rate
6.81%
Mortgage Type
New Conventional
Estimated Equity
$124,235
Purchase Details
Closed on
Oct 13, 1997
Sold by
Pillifant Leo
Bought by
Hendrickson Dale T and Hendrickson Jennifer L
Home Financials for this Owner
Home Financials are based on the most recent Mortgage that was taken out on this home.
Original Mortgage
$114,111
Interest Rate
7.49%
Mortgage Type
FHA
Purchase Details
Closed on
Oct 10, 1997
Sold by
Lapierre Linda Lee and Pillifant Linda Lee
Bought by
Pillifant Leo
Home Financials for this Owner
Home Financials are based on the most recent Mortgage that was taken out on this home.
Original Mortgage
$114,111
Interest Rate
7.49%
Mortgage Type
FHA
Create a Home Valuation Report for This Property
The Home Valuation Report is an in-depth analysis detailing your home's value as well as a comparison with similar homes in the area
Home Values in the Area
Average Home Value in this Area
Purchase History
| Date | Buyer | Sale Price | Title Company |
|---|---|---|---|
| Tapani Jake | -- | Chicago Title | |
| Hendrickson Dale T | $115,000 | Chicago Title Insurance Co | |
| Pillifant Leo | -- | Chicago Title Insurance |
Source: Public Records
Mortgage History
| Date | Status | Borrower | Loan Amount |
|---|---|---|---|
| Open | Tapani Jake | $387,000 | |
| Previous Owner | Hendrickson Dale T | $114,111 |
Source: Public Records
Tax History Compared to Growth
Tax History
| Year | Tax Paid | Tax Assessment Tax Assessment Total Assessment is a certain percentage of the fair market value that is determined by local assessors to be the total taxable value of land and additions on the property. | Land | Improvement |
|---|---|---|---|---|
| 2025 | $3,506 | $446,057 | $185,000 | $261,057 |
| 2024 | $3,236 | $429,872 | $185,000 | $244,872 |
| 2023 | $3,136 | $451,358 | $185,000 | $266,358 |
| 2022 | $3,272 | $398,786 | $150,700 | $248,086 |
| 2021 | $3,195 | $361,661 | $137,500 | $224,161 |
| 2020 | $2,719 | $323,855 | $126,500 | $197,355 |
| 2019 | $2,215 | $312,357 | $129,800 | $182,557 |
| 2018 | $2,719 | $297,650 | $0 | $0 |
| 2017 | $2,017 | $268,540 | $0 | $0 |
| 2016 | $1,981 | $216,863 | $0 | $0 |
| 2015 | $1,934 | $195,457 | $0 | $0 |
| 2014 | -- | $181,010 | $0 | $0 |
| 2013 | -- | $162,677 | $0 | $0 |
Source: Public Records
Map
Nearby Homes
- 711 NE 6th St
- 722 NE 4th Way
- 1306 NE 8th Ave
- 1328 NE 8th Ave
- 1342 NE 8th Ave
- 1350 NE 8th Ave
- 1334 NE 8th Ave
- 907 NE 1st Ave
- 813 NE Grace Ave
- 902 N Parkway Ave
- 741 NE 13th St
- 743 NE 13th St
- 17 NE 12th St
- 745 NE 13th St
- 747 NE 13th St
- 749 NE 13th St
- 751 NE 13th St
- 753 NE 13th St
- 1320 NE Clark Ave
- 1006 NE 11th Cir