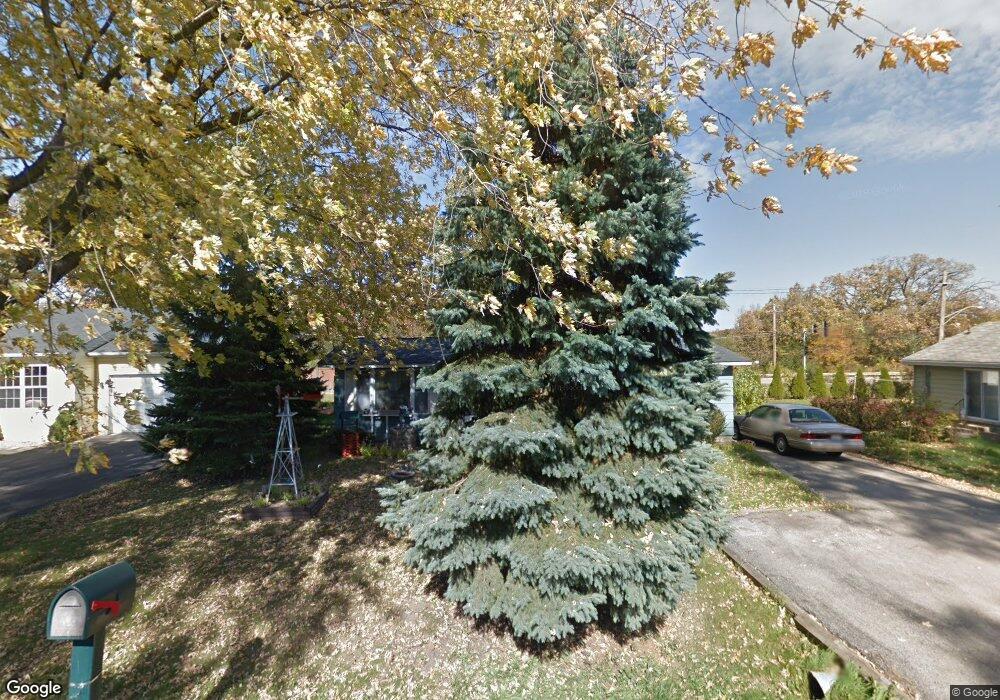
414 Rand Dr McHenry, IL 60051
Pistakee Highlands NeighborhoodEstimated Value: $226,000 - $259,983
3
Beds
2
Baths
1,104
Sq Ft
$221/Sq Ft
Est. Value
About This Home
This home is located at 414 Rand Dr, McHenry, IL 60051 and is currently estimated at $243,496, approximately $220 per square foot. 414 Rand Dr is a home located in McHenry County with nearby schools including Ringwood School Primary Center, Johnsburg Elementary School, and Johnsburg Jr High School.
Ownership History
Date
Name
Owned For
Owner Type
Purchase Details
Closed on
Dec 14, 2017
Sold by
Wilmington Savings Fundj Society
Bought by
Board Of Directors Of Said Corporation
Current Estimated Value
Home Financials for this Owner
Home Financials are based on the most recent Mortgage that was taken out on this home.
Original Mortgage
$118,655
Outstanding Balance
$102,196
Interest Rate
4.87%
Mortgage Type
New Conventional
Estimated Equity
$141,300
Purchase Details
Closed on
Mar 31, 2017
Sold by
Quilling Erna
Bought by
Wilimington Savings Fund Society Fsb and Christian Trusts
Purchase Details
Closed on
May 25, 2010
Sold by
Plawinski Wilma
Bought by
Quilling Wilhelm and Quilling Erna
Home Financials for this Owner
Home Financials are based on the most recent Mortgage that was taken out on this home.
Original Mortgage
$114,008
Interest Rate
4.87%
Mortgage Type
FHA
Purchase Details
Closed on
Jul 16, 1999
Sold by
Richardson Susan J
Bought by
Plawinski Wilma
Home Financials for this Owner
Home Financials are based on the most recent Mortgage that was taken out on this home.
Original Mortgage
$104,704
Interest Rate
7.43%
Mortgage Type
FHA
Create a Home Valuation Report for This Property
The Home Valuation Report is an in-depth analysis detailing your home's value as well as a comparison with similar homes in the area
Home Values in the Area
Average Home Value in this Area
Purchase History
| Date | Buyer | Sale Price | Title Company |
|---|---|---|---|
| Board Of Directors Of Said Corporation | -- | None Available | |
| Wilimington Savings Fund Society Fsb | -- | None Available | |
| Quilling Wilhelm | $121,500 | Chicago Title | |
| Plawinski Wilma | $105,000 | -- |
Source: Public Records
Mortgage History
| Date | Status | Borrower | Loan Amount |
|---|---|---|---|
| Open | Board Of Directors Of Said Corporation | $118,655 | |
| Previous Owner | Quilling Wilhelm | $114,008 | |
| Previous Owner | Plawinski Wilma | $104,704 |
Source: Public Records
Tax History
| Year | Tax Paid | Tax Assessment Tax Assessment Total Assessment is a certain percentage of the fair market value that is determined by local assessors to be the total taxable value of land and additions on the property. | Land | Improvement |
|---|---|---|---|---|
| 2024 | $4,644 | $77,417 | $5,953 | $71,464 |
| 2023 | $3,524 | $55,814 | $14,191 | $41,623 |
| 2022 | $3,475 | $51,780 | $13,165 | $38,615 |
| 2021 | $3,298 | $48,221 | $12,260 | $35,961 |
| 2020 | $3,186 | $46,211 | $11,749 | $34,462 |
| 2019 | $3,128 | $43,881 | $11,157 | $32,724 |
| 2018 | $3,405 | $40,403 | $10,651 | $29,752 |
| 2017 | $3,328 | $37,919 | $9,996 | $27,923 |
| 2016 | $2,282 | $35,438 | $9,342 | $26,096 |
| 2013 | -- | $34,128 | $9,197 | $24,931 |
Source: Public Records
Map
Nearby Homes
- 706 Henry Trail
- Lot 11 Blk 4 Acorn Ln
- 6415 N Shore Ave
- 38265 N State Park Rd
- 5504 Louella Ave
- 37682 N US Highway 12
- 37714 N Nippersink Place
- 37706 N Nippersink Place
- 1001 W Broadway St
- 707 Kingston Blvd
- 28624 W Kendall Ave
- 5207 N Lake St
- 615 W Eastern Ave
- 55 Vail Colony Unit 6
- 5302 Autumn Way
- 11 Saint Thomas Colony Unit 7
- 1023 Hooks Ln
- 35 Montego Colony Unit 7
- 63 Aspen Colony Unit 8
- 40 Bermuda Colony Unit 7
Your Personal Tour Guide
Ask me questions while you tour the home.