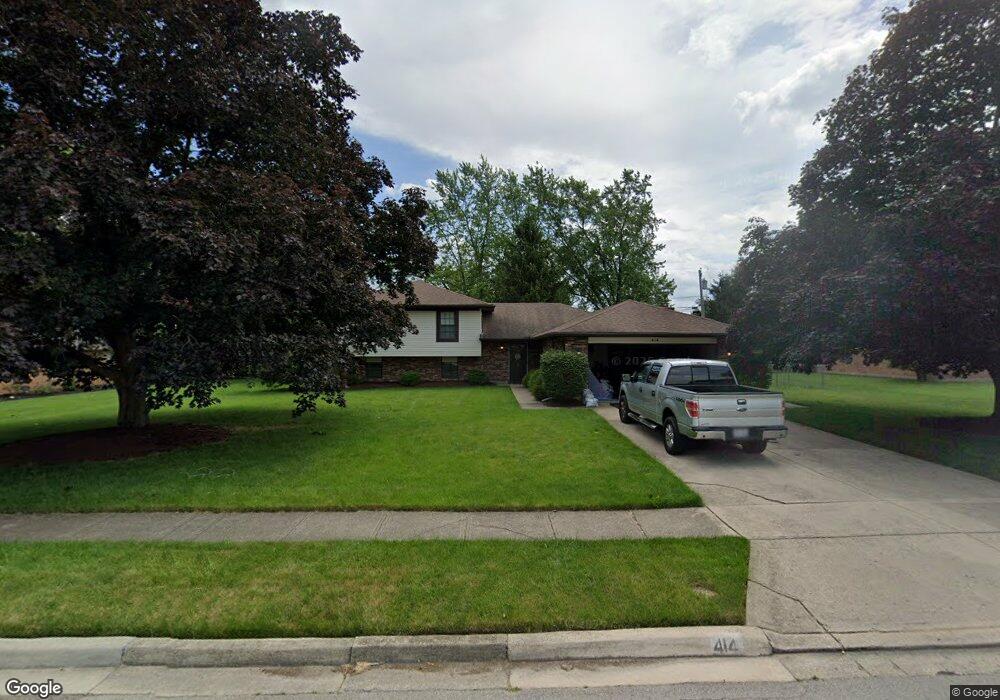
414 Rankin Dr Englewood, OH 45322
Estimated Value: $260,000 - $309,084
3
Beds
3
Baths
2,523
Sq Ft
$114/Sq Ft
Est. Value
About This Home
This home is located at 414 Rankin Dr, Englewood, OH 45322 and is currently estimated at $286,521, approximately $113 per square foot. 414 Rankin Dr is a home located in Montgomery County with nearby schools including Northmont High School.
Ownership History
Date
Name
Owned For
Owner Type
Purchase Details
Closed on
Aug 19, 2020
Sold by
Mangen Troy and Swartzstrauber Kinsey
Bought by
Mangen Troy and Mangen Kinsey
Current Estimated Value
Home Financials for this Owner
Home Financials are based on the most recent Mortgage that was taken out on this home.
Original Mortgage
$140,000
Outstanding Balance
$123,958
Interest Rate
2.9%
Mortgage Type
New Conventional
Estimated Equity
$162,563
Purchase Details
Closed on
May 22, 2019
Sold by
Lorenz William J
Bought by
Swartzstrauber Kinsey and Mangen Troy
Home Financials for this Owner
Home Financials are based on the most recent Mortgage that was taken out on this home.
Original Mortgage
$140,000
Interest Rate
4.1%
Mortgage Type
New Conventional
Purchase Details
Closed on
Nov 21, 2018
Sold by
Estate Of Sharon Lee Lorenz
Bought by
Lorenz William J
Purchase Details
Closed on
Dec 13, 2013
Sold by
Goin Patricia A
Bought by
Lorenz William J and Lorenz Sharon L
Create a Home Valuation Report for This Property
The Home Valuation Report is an in-depth analysis detailing your home's value as well as a comparison with similar homes in the area
Home Values in the Area
Average Home Value in this Area
Purchase History
| Date | Buyer | Sale Price | Title Company |
|---|---|---|---|
| Mangen Troy | -- | None Available | |
| Swartzstrauber Kinsey | $175,000 | None Available | |
| Lorenz William J | -- | None Available | |
| Lorenz William J | $132,500 | National Title |
Source: Public Records
Mortgage History
| Date | Status | Borrower | Loan Amount |
|---|---|---|---|
| Open | Mangen Troy | $140,000 | |
| Closed | Swartzstrauber Kinsey | $140,000 |
Source: Public Records
Tax History Compared to Growth
Tax History
| Year | Tax Paid | Tax Assessment Tax Assessment Total Assessment is a certain percentage of the fair market value that is determined by local assessors to be the total taxable value of land and additions on the property. | Land | Improvement |
|---|---|---|---|---|
| 2024 | $4,792 | $83,920 | $11,490 | $72,430 |
| 2023 | $4,792 | $83,920 | $11,490 | $72,430 |
| 2022 | $4,379 | $59,000 | $8,090 | $50,910 |
| 2021 | $4,494 | $59,000 | $8,090 | $50,910 |
| 2020 | $4,298 | $59,000 | $8,090 | $50,910 |
| 2019 | $3,051 | $46,240 | $9,300 | $36,940 |
| 2018 | $2,995 | $46,240 | $9,300 | $36,940 |
| 2017 | $2,975 | $46,240 | $9,300 | $36,940 |
| 2016 | $2,846 | $43,980 | $8,090 | $35,890 |
| 2015 | $2,639 | $43,980 | $8,090 | $35,890 |
| 2014 | $2,639 | $43,980 | $8,090 | $35,890 |
| 2012 | -- | $50,910 | $9,040 | $41,870 |
Source: Public Records
Map
Nearby Homes
- 322 Rankin Dr
- 321 Rankin Dr
- 332 Beckenham Rd
- 408 W Herr St
- 320 Camborne Dr
- 308 Magnolia Ave
- 118 Elm Ct
- 604 Heather St
- 430 N Main St
- 63 Sweet Potato Ridge Rd
- 123 Chestnut St
- 128 Union Ridge Dr
- 402 Bramlage Ln
- 106 Warner Dr
- 208 S Walnut St
- 4005 Clearstream Way
- 200 Sheets St
- 108 Tate Ave
- 607 Albert St
- 600 W Martindale Rd
- 412 Rankin Dr
- 416 Rankin Dr
- 324 Beechgrove Dr
- 322 Beechgrove Dr
- 415 Rankin Dr
- 326 Beechgrove Dr
- 410 Rankin Dr
- 418 Rankin Dr
- 413 Rankin Dr
- 417 Rankin Dr
- 320 Beechgrove Dr
- 328 Beechgrove Dr
- 411 Rankin Dr
- 419 Rankin Dr
- 408 Rankin Dr
- 420 Rankin Dr
- 318 Beechgrove Dr
- 330 Beechgrove Dr
- 409 Rankin Dr
- 421 Rankin Dr